B2B ICP and Account Scoring: The 2025 GTM Guide
The Architecture of B2B Revenue Efficiency: Ideal Customer Profiles, Account Scoring, and Opportunity-Centric Go-To-Market Strategies
The macroeconomic climate defining the 2025 and 2026 fiscal years has introduced profound structural headwinds for global business-to-business (B2B) markets. With global gross domestic product (GDP) growth forecasts decelerating to approximately 2.9% in 2025 and 2.8% in 2026, and United States GDP growth estimated at a highly constrained 1.4%, commercial expansion is operating under severe capital limitations. Consequently, enterprise budgets are being meticulously backward-planned, rooted entirely in guaranteed pipeline impact rather than top-of-funnel brand reach or vanity metrics. Chief Financial Officers (CFOs) are demanding rigorous proof of profitable growth, leading to sustained pressure on marketing budgets, which stagnated at approximately 7.7% of overall company revenue heading into this economic cycle.

In this constrained environment, traditional demand generation tactics—characterized by vast, unfiltered outreach, gated content, and cold digital acquisition without behavioral signaling—yield rapidly diminishing returns and escalate the overall cost-to-serve. The modern B2B buyer is more cautious, highly informed, and increasingly selective. Buyers now utilize an average of ten distinct channels across their purchasing journey, conducting extensive independent research and often bypassing early sales touchpoints entirely.
To survive and compound competitive advantages in this ecosystem, B2B organizations must fundamentally restructure their go-to-market (GTM) operations. Omnichannel engagement, once considered a cutting-edge competitive differentiator, has devolved into a mere survival threshold. Precision targeting, hyperpersonalization, and artificial intelligence-driven resource allocation now define the modern commercial operating system. Central to this transformation is the rigorous application of the Ideal Customer Profile (ICP), the deployment of advanced account scoring mathematical models, and the structural evolution toward an opportunity-centric revenue process that aligns completely with the realities of corporate buying groups.
Architecting the Definitional Framework: Target Audiences, Buyer Personas, and the ICP
A pervasive and highly destructive structural flaw in many GTM strategies is the conflation of broad market segments, account-level profiles, and individual buyer personas. Treating these distinct analytical frameworks as interchangeable inevitably leads to misaligned messaging, misallocated advertising budgets, and wasted human capital. An optimized revenue engine sequences these definitions hierarchically, understanding that each serves a highly specific operational function.
The target audience represents the broadest segment of the market accessible to an organization through geographical boundaries, channel availability, or high-level intent parameters. While useful for top-of-funnel media planning and general brand awareness, target audiences lack the granularity required for enterprise sales prioritization. Conversely, a buyer persona is a psychographic and demographic composite of the individual decision-maker operating within an account. Personas capture the localized motivations, career objectives, daily frictions, and reporting structures of specific roles, such as a Vice President of Marketing struggling with lead generation efficiency, or a Chief Information Security Officer concerned with compliance.
The Ideal Customer Profile (ICP) serves as the indispensable architectural bridge between the macroeconomic target audience and the microeconomic buyer persona. The ICP defines the perfect organizational entity—the account or company itself—that derives the maximum value from a specific solution and generates the highest customer lifetime value with the lowest acquisition and support costs. Attempting to construct detailed buyer personas without first establishing a rigid, mathematically validated ICP frequently results in a catastrophic misallocation of resources, as marketing teams craft highly detailed psychological profiles for individuals working inside companies that are fundamentally unprofitable to acquire. Data indicates that B2B organizations operating with a strictly defined ICP experience up to a 68% higher account win rate, primarily because they focus their finite resources exclusively on high-probability leads rather than chasing every entity that demonstrates casual interest.
| Framework Category | Analytical Focus | Core Variables Evaluated | Strategic Function |
|---|---|---|---|
| Target Audience | Macro-level market segments | Channel accessibility, general geography, broad industry categories | Media planning, broad brand awareness, and initial funnel construction. |
| Ideal Customer Profile (ICP) | Organizational and account fit | Firmographics, technographics, revenue, growth stage, negative indicators | Account prioritization, qualification criteria, pipeline focus, and resource allocation. |
| Buyer Persona | Individual human decision-makers | Job titles, specific challenges, psychological goals, reporting structures | Messaging customization, content thematic development, and sales objection handling. |

The Five-Dimensional Architecture of the Ideal Customer Profile
An effective ICP is not a static document derived from anecdotal sales assumptions or qualitative brainstorming sessions; it is a dynamic, multi-dimensional data model that must be rigorously validated against closed-won revenue. Modern ICP architectures have evolved far beyond simple firmographic definitions to encompass a comprehensive five-layered analytical framework.
Layer 1: Firmographic Fit
This foundational layer establishes the basic structural parameters of the target organization. However, operationalizing firmographics requires extreme precision. Broad descriptors such as “Technology Sector” are not actionable; instead, organizations must utilize precise definitions such as “B2B SaaS, Series B-D, 100–2,000 employees”. Firmographic variables dictate deal size, sales cycle length, and the complexity of the buying process. Furthermore, for venture-backed entities, the specific funding stage acts as a critical firmographic variable. A company operating post-Series B is typically actively scaling its revenue stack and acquiring net-new platforms, exhibiting entirely different purchasing behaviors and urgencies than a post-Series D company that is highly focused on optimizing for profitability and minimizing software bloat. Geography also plays a vital role in this layer, directly impacting compliance requirements, language localization, and the necessary GTM motion.
Layer 2: Technographic Fit
The digital technology stack utilized by a prospect provides profound visibility into their budget capacity, operational maturity, and technical integration requirements. Technographic intelligence reveals whether a prospect utilizes compatible infrastructure (e.g., assessing whether a company runs on HubSpot versus Salesforce fundamentally alters the integration narrative). Furthermore, the presence of specific adjacent tools signals organizational maturity; a company deploying Marketo likely possesses a highly mature demand generation function, whereas a company relying on basic email software does not. Crucially, the presence of a direct competitor’s software acts as a highly predictive variable. If an organization is already paying for a competitive platform, it definitively proves they possess an allocated budget and actively recognize the business problem, making competitive displacement a highly valid and lucrative ICP criterion.
Layer 3: Behavioral and Business Signals
Unlike static firmographics, behavioral signals track real-time organizational shifts and temporal momentum. These include macroeconomic events such as recent funding rounds, rapid hiring trajectories in specific departments, or the appointment of new executive leadership (such as a newly installed Chief Revenue Officer or Chief Marketing Officer). The six-month window following a major executive transition or a large funding event statistically represents the highest propensity to purchase, as new leaders historically execute widespread architectural changes and deploy newly acquired capital. Additionally, technology changes—such as migrating core CRMs or dropping a competitor product—serve as massive behavioral indicators of an active evaluation cycle.
Layer 4: Organizational Readiness
This layer assesses internal infrastructure to determine if a company is structurally capable of adopting the vendor’s solution. A high-fit organization must possess the necessary personnel to adopt and extract value from the product. This requires the verified presence of target decision-makers; without a clear executive sponsor, complex B2B deals are highly prone to stalling indefinitely in purchasing committees. Team size is also a critical metric. If a software solution requires a minimum active user base of five individuals to demonstrate a positive return on investment, organizations lacking that specific departmental headcount are disqualified regardless of their overall corporate revenue. Process maturity is equally important; a company that has never run an outbound sales motion will require vastly more onboarding resources than a mature organization simply swapping out an existing tool.
Layer 5: Negative Indicators
Precision targeting requires defining absolute disqualifiers.
Equally important to defining who is a fit is explicitly defining who is not. Negative indicators highlight attributes that forecast high churn rates, unprofitable sales cycles, or stagnant expansion potential. Strategic exclusion of accounts exhibiting negative indicators—such as active workforce reductions, hiring freezes, operation in historically unprofitable sub-industries, or company sizes that historically never expand past their initial contract value—preserves scarce sales bandwidth and protects long-term unit economics.
To operationalize this five-layer framework, revenue operations teams must ingest historical Customer Relationship Management (CRM) data, analyzing the trailing twelve months of closed-won deals to extract the shared characteristics of the fastest-closing and highest-retaining accounts. Crucially, these traits must be cross-referenced against closed-lost data. If a specific firmographic trait is equally prevalent in both won and lost columns, it holds no predictive statistical value and must be discarded from the scoring algorithm. For early-stage companies lacking vast historical CRM data, modern GTM platforms utilize “agentic search” driven by AI to surface lookalike profiles, dynamically matching complex natural-language queries against real-time multi-source data to identify high-fit accounts.
The Taxonomy and Orchestration of B2B Intent Signals
With the structural ICP perfectly established, organizations must deploy sensing mechanisms to detect exactly when these ideal accounts enter an active purchasing cycle. Market research indicates that only approximately 5% of an organization’s total addressable market (TAM) is actively looking to purchase a solution at any given moment. Distinguishing the active 5% from the dormant 95% requires the sophisticated aggregation of multi-tiered intent data. Intent data operates across a spectrum of fidelity and reach, categorized systematically into first-party, second-party, and third-party sources.
| Intent Category | Data Origin | Reach | Signal Fidelity | Strategic Application |
|---|---|---|---|---|
| First-Party | Owned digital properties (website, email, product trials) | Narrow (limited to known audience) | Exceptionally High | Triggering direct, person-level outbound sales outreach and immediate follow-up. |
| Second-Party | Partner networks and independent review platforms (e.g., G2, TrustRadius) | Moderate | High (indicates active vendor comparison) | Identifying accounts deep in the consideration and evaluation phases of the buying cycle. |
| Third-Party | Massive external publisher networks and data cooperatives (e.g., Bombora) | Extremely Broad | Lower (indicates topic research, not brand affinity) | Market-wide account prioritization, early-stage awareness targeting, and ABM list building. |
First-party intent encompasses the behavioral data generated directly on an organization’s owned digital properties. This includes the reverse-IP resolution of anonymous website traffic to specific accounts, content downloads, pricing page dwell times, product trial telemetry, and deep email engagement. First-party data provides the highest possible fidelity because the account is explicitly interacting with the vendor’s specific brand and solutions, signaling direct evaluation. However, its scope is inherently limited to accounts that have already discovered the vendor.
Second-party intent is defined as first-party data collected by a trusted intermediary, typically a peer-review platform or a technology comparison engine. When prospective buyers research specific software categories, consume peer reviews, or run side-by-side vendor comparisons on independent platforms, that activity signal is licensed back to the vendor. This signal indicates a high concentration of purchase-stage readiness, as buyers utilizing comparison engines are typically advancing toward final vendor selection.
Third-party intent relies on large-scale data cooperatives tracking anonymous research activity across thousands of external B2B publisher networks and editorial sites. Platforms utilizing third-party intent, such as Bombora, analyze content consumption against a historical baseline average to detect a statistical “surge” in topical research by a specific company. While third-party data offers massive reach—identifying accounts researching a problem long before they ever visit a vendor’s website—it suffers from lower signal fidelity. The data confirms an organization is researching a category, but it rarely identifies the specific individual conducting the research, nor does it guarantee budget availability. The gap between knowing that an enterprise is researching “cloud security” and knowing which Vice President to call is where many elementary intent investments fail.
High-performing GTM architectures synthesize all three layers. Predictive intent platforms do not act as a new source of data, but rather as orchestration layers that ingest first, second, and third-party signals to output a unified buying-stage score. Third-party intent functions as a wide-aperture radar, prioritizing accounts within the broader market for targeted advertising. As those accounts engage and transition to first-party properties, first-party intent acts as a high-resolution targeting mechanism to trigger direct outbound sales outreach to specific decision-makers.
The Product-Led Growth (PLG) Paradox and Hybrid Go-To-Market Motions
Within the context of Product-Led Growth (PLG) architectures, the evaluation of intent fractures into a dichotomy between Marketing Qualified Leads (MQLs) and Product Qualified Leads (PQLs). This division frequently creates immense operational friction between marketing, product, and sales organizations, as each department relies on fundamentally different datasets to measure purchasing propensity.
MQLs are traditionally defined by top-of-funnel engagement with marketing collateral—such as whitepapers, webinars, or demo requests—combined with basic demographic fit. MQLs prove a buyer has a declared interest in a category before they have a product experience. However, MQL scoring frequently suffers from generating “high-intent, low-fit” anomalies. For instance, a university student downloading comprehensive platform documentation for academic research generates intense MQL signals while possessing zero commercial authority. Furthermore, MQLs fail to reflect whether a buyer actually understands the product’s value proposition through direct usage.
Conversely, PQLs prioritize actual behavioral adoption within a freemium or trial environment, capturing activation milestones, feature utilization, daily active usage, and teammate invitations. PQLs provide undeniable behavioral evidence of value realization. However, they carry an inverse risk: generating “high-usage, low-intent to pay” profiles. A technical end-user, such as a junior developer maximizing a free software tier, may demonstrate phenomenal PQL metrics, but if they lack executive sponsorship or budgetary authority, expensive sales resources deployed to close them will yield no revenue.
| Lead Framework | Signal Source | Primary Evidence Provided | Common Limitations | Optimal Use Case |
|---|---|---|---|---|
| Marketing Qualified Lead (MQL) | Marketing engagement (webinars, emails, form fills) | Declared category interest prior to product usage. | High intent but low fit; does not prove product understanding. | Sales-led motions, enterprise demand generation. |
| Product Qualified Lead (PQL) | Product telemetry (feature usage, logins, invitations) | Behavioral evidence of value realization. | High usage but low intent/ability to pay. | Self-serve motions, freemium conversions. |
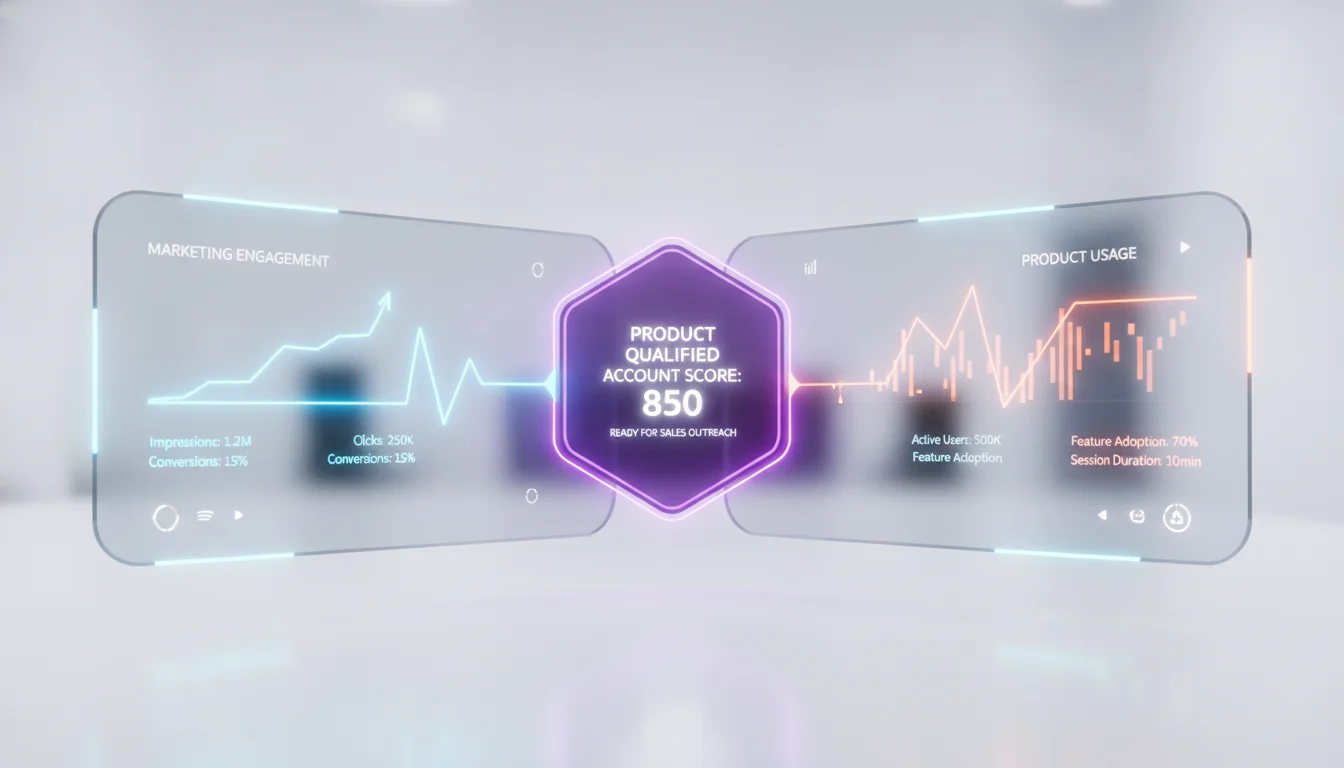
The optimal resolution to this paradox is the construction of a hybrid evaluation matrix. MQL frameworks capture the declared, top-down commercial intent that product telemetry is blind to, while PQL frameworks capture the bottom-up behavioral validation that marketing platforms cannot see. Relying on only one framework means scoring an account with partial information. Modern revenue engines roll both MQL and PQL signals upward into a unified, account-level assessment, generating a comprehensive Product Qualified Account (PQA) profile. A PQA validates both technical adoption by end-users and executive commercial intent from decision-makers simultaneously, ensuring that sales engages only when an organization has proven both the technical desire and the financial capacity to buy.
The Evolution of Account Scoring Methodologies
Translating raw demographic characteristics and multi-channel behavioral signals into an actionable sequence requires robust account scoring architectures.
Account scoring algorithms filter noisy data into a unified quantitative ranking, functioning similarly to consumer credit scores but applied to corporate entities. The discipline of account scoring operates heavily on the Pareto principle, recognizing that roughly 20% of an engaged total addressable market contributes to more than 80% of a company’s pipeline and eventual revenue. By effectively routing focus, account scoring prevents the severe revenue leakage that occurs when highly compensated sales personnel waste bandwidth chasing low-probability targets.
Organizations typically mature through two distinct phases of account scoring: manual rule-based heuristics and predictive artificial intelligence (AI) modeling.
Manual, Rule-Based Scoring Systems
Manual account scoring relies on static, rule-based logic dictated by human operators. Revenue operations teams assign arbitrary point values to specific firmographic attributes or behavioral actions—for example, allocating +20 points for an enterprise-tier employee count, +15 points for a pricing page visit, or +10 points for webinar attendance.
The primary advantage of manual scoring is its absolute transparency. When a sales representative questions why an account has been routed to them, the underlying logic is immediately visible and justifiable in a single sentence. Rule-based models are highly effective for early-stage organizations or those dealing with low transaction volumes where human intuition is required to supplement sparse datasets, as machine learning models require vast data volumes to find meaningful patterns.
However, rule-based systems are inherently fragile and rapidly become obsolete. They merely reflect the human assumptions of buyer behavior at the exact moment the model was constructed, remaining rigid while market dynamics shift. They struggle immensely to scale; recalculating thousands of accounts manually is administratively unfeasible. Furthermore, they are highly susceptible to human bias and fail entirely to uncover complex, multi-layered behavioral correlations that precede a purchase.
Predictive Artificial Intelligence (AI) Scoring
Predictive AI scoring replaces static human assumptions with dynamic statistical algorithms, leveraging machine learning paradigms such as logistic regression and gradient boosting to analyze vast datasets of historical conversions. Predictive engines continuously ingest thousands of permutations of firmographic, technographic, and real-time engagement data.
The predictive scoring process begins with automated data collection from disparate sources, followed by rigorous data cleaning to resolve duplication errors and inconsistencies. The algorithms then perform “feature engineering,” mathematically transforming raw data elements—such as raw time spent on a website—into complex, actionable predictive variables. By evaluating both historical wins and closed-lost data, the model detects subtle, non-obvious correlations that human operators miss, identifying the exact sequence of multi-channel behaviors that precede a purchase.
Crucially, AI scoring is self-correcting and highly dynamic. When an account predicted to close fails to convert, or an unexpected account generates massive revenue, the AI learns from the outcome and recalibrates its weightings in real-time, removing bias and continuously improving accuracy. Industry data suggests that leveraging predictive AI scoring eliminates guesswork and increases sales acceptance rates by up to 35% compared to static, rule-based models.
| Scoring Attribute | Manual Rule-Based Scoring | Predictive AI Scoring |
|---|---|---|
| Analytical Foundation | Human intuition and static logic. | Machine learning and statistical correlations. |
| Adaptability | Rigid; requires manual recalculation. | Dynamic; automatically recalibrates in real-time. |
| Scalability | Low; struggles with high data volume. | Exceptionally High; processes thousands of variables simultaneously. |
| Data Requirements | Functions acceptably on sparse, limited datasets. | Requires high-volume, clean historical data to train models. |
| Susceptibility to Bias | High; reflects operator assumptions and prejudices. | Low; strictly data-driven and objective. |
The Two-Dimensional Matrix: Fit Versus Engagement
A frequent point of failure in unified scoring systems is the conflation of static account fit with temporal account engagement, resulting in a single, blended score that obscures reality. A high, singular score might represent a perfect ICP match that is completely inactive, or conversely, an incredibly active user who has absolutely no business utility for the product. To make scores actionable and trusted by sales personnel, the scoring system must split the evaluation into two distinct axes.
This creates a two-dimensional matrix evaluating:
- Fit Score (The Y-Axis): An evaluation of who the prospect is, mapped strictly against the five-layer ICP (firmographics, technographics, negative indicators).
- Engagement Score (The X-Axis): An evaluation of what the prospect is doing, tracking behavioral velocity across channels (web visits, form fills, product telemetry).
Plotting accounts across these axes generates four highly operational quadrants, each demanding a distinct GTM action protocol:
- High Fit + High Engagement: These are the highest-priority accounts demonstrating both perfect architectural alignment and active intent. They require immediate routing to sales executives under strict speed-to-lead Service Level Agreements (SLAs), often requiring outreach within 48 hours.
- High Fit + Low Engagement: These are ideal targets that have not yet entered an active buying cycle. They are routed to marketing for targeted account-based nurturing and long-term, adaptive outbound sequences to slowly build awareness.
- Low Fit + High Engagement: This quadrant is notorious for false positives—such as students, minor consultants, or competitors monitoring pricing pages. Because they lack buying authority or ICP fit, sales is advised to qualify them with extreme caution to avoid wasting valuable bandwidth.
- Low Fit + Low Engagement: These prospects are systematically suppressed and excluded from all sales outreach and marketing spend.
The MQA Rollup and Breadth Multipliers
For complex enterprise sales, engagement scores cannot rely on single actors. The model must utilize a Marketing Qualified Account (MQA) rollup mechanism. The MQA logic aggregates the maximum individual engagement scores within an organization, but heavily modifies the baseline via mathematical multipliers when multiple distinct stakeholders are active simultaneously.
Deals are exponentially more likely to close when multiple distinct stakeholders engage rather than a single champion. To operationalize this, a breadth multiplier is applied. For example, multiplying the base engagement score by 1 + (0.2 * number_of_engaged_contacts) ensures that three decision-makers taking independent action yields a substantially higher score than one single contact executing the same total volume of actions. Points are specifically added when engagement crosses departmental boundaries (e.g., both IT and Finance) or spans multiple levels of seniority. Furthermore, scoring algorithms apply “channel diversity bonuses,” mathematically rewarding accounts that engage across three or more disparate vectors—such as website browsing combined with webinar attendance and direct product usage.
Mathematical Degradation: Time Decay Attribution in Account Scoring
A critical component of engagement scoring is understanding that B2B behavioral signals have a highly volatile half-life. A software demonstration request from yesterday is an urgent pipeline indicator; a demonstration request from nine months ago is statistically irrelevant.
To accurately model the recency bias inherent in buyer behavior, account scoring frameworks must deploy time decay attribution models. Time decay utilizes an exponential decay function to mathematically diminish the point value of an action as it moves further into the past. The continuous degradation of signal value ensures that recent engagement carries heavily weighted predictive power, while historical actions fade into irrelevance.
This process is governed by the following mathematical formula:
In this equation:
- represents the temporal gap, measured in exact days, between the historical engagement event and the current scoring calculation.
- represents the parameterized duration after which the engagement event retains exactly 50% of its original strategic weight.
Once the raw weights for every single touchpoint in the buyer’s journey are computed using this exponential formula, they are normalized so the total allocated credit across all touchpoints per conversion sums exactly to 100%. While default configurations in general marketing analytics platforms (such as Google Analytics) often utilize a standard 7-day half-life, B2B revenue operations must heavily customize this parameter. Using a 7-day half-life, an action taken on the day of conversion receives a weight of 1.0; at 7 days prior, it drops to 0.5; and at 14 days prior, it plummets to 0.25. In enterprise motions with typical sales cycles extending between 30 and 90+ days, a 7-day half-life creates excessive score volatility, prematurely dropping highly qualified accounts out of active sales queues simply because a buying committee took a two-week deliberation pause. Adjusting the half-life to align directly with the median deal cycle of the specific organization ensures that the account score maintains mathematical stability while correctly prioritizing recency. Applying this continuous decay prevents pipeline bloat and forces sales teams to recognize when an account’s true interest has evaporated, requiring precise, event-level tracking with clean, timestamped data to function.
Account Tiering and Resource Orchestration in ABM
The quantitative output of the scoring algorithms serves no operational purpose unless mapped directly to a resource allocation matrix. Account-Based Marketing (ABM) and sales orchestration leverage aggregated account scores to place target organizations into strictly segregated priority tiers, dictating the exact volume of human and financial capital expended. To maintain operational clarity and prevent reps from becoming overwhelmed, segmentation models are universally recommended to be restricted to three distinct tiers.
Tier 1: The Strategic Vanguard (High-Value, High-Touch)
Tier 1 represents the absolute apex of the scoring model—organizations exhibiting flawless multi-dimensional ICP fit coupled with explosive, multi-threaded engagement signals. Though constituting only 5% to 10% of the total target account volume, Tier 1 accounts logically consume 50% to 60% of total commercial bandwidth and selling time.
The GTM motion for Tier 1 is entirely a 1:1, high-touch orchestration. Marketing and sales teams deeply co-own the account. Investment here supports bespoke content creation, highly personalized executive-to-executive alignment, custom direct mail, and the generation of deep financial business cases. Measurement within Tier 1 abandons volume-based metrics entirely, focusing exclusively on qualitative deal progression, the penetration of the complex buying group, executive meeting quality, and pipeline velocity.
Tier 2: The Growth Segment (Cluster-Based Personalization)
Tier 2 accounts demonstrate strong fundamental ICP fit but currently lack the immediate, surging behavioral intent necessary to justify Tier 1 expenditure. These accounts represent latent revenue potential that must be nurtured systematically until their timing aligns.
The operational strategy for Tier 2 shifts to a 1:few cluster-based approach. Resources are distributed across defined segments, utilizing targeted digital media, industry-specific personalized campaigns, and automated intent-signal monitoring. Human sales involvement is primarily reactive; direct human outreach is held in reserve and instantly triggered only when the automated systems detect an intent spike that elevates the account’s score into the active threshold. Success metrics for Tier 2 prioritize engagement depth, multi-touch interaction tracking across different roles, and the generation of sales-accepted opportunities.
Tier 3: Scalable Programmatic Execution
Tier 3 encapsulates the broad remainder of the addressable market. These accounts meet basic firmographic eligibility criteria but may possess lower total revenue potential, weaker technographic fit, or currently demonstrate zero engagement.
Capital preservation and cost-efficiency are the dominant objectives in Tier 3. The strategy is purely 1:many, relying heavily on algorithmic scale, programmatic advertising, content syndication, and marketing automation infrastructure. The budget per account remains exceptionally low, but technology investment is significant to maintain scale. Human sales intervention is strictly prohibited unless an account demonstrates profound inbound activity. Marketing operations claim exclusive governance over this tier, measuring success via incremental pipeline creation, brand reach, and broad intent lift.
| ABM Tier | Volume & Focus | Operational Strategy | GTM Resource Allocation | Primary Success Metrics |
|---|---|---|---|---|
| Tier 1 | Top 5-10% of accounts | 1:1 Highly personalized ABM | 50-60% of sales time; bespoke content, executive outreach. | Deal progression, buying group penetration, pipeline velocity. |
| Tier 2 | Next 20-30% of accounts | 1:few Cluster-based ABM | Automated intent monitoring; sales engages only upon trigger. | Engagement depth, content consumption across roles, sales acceptance. |
| Tier 3 | Broad addressable market | 1:many Programmatic scale | Low per-account budget; fully automated nurture, zero proactive sales. | Reach, intent lift, marketing-qualified account generation. |
The Shift to Opportunity-Centric Revenue Processes
As GTM architectures advance through predictive scoring and rigorous ABM tiering, a fundamental paradigm shift is occurring regarding the underlying data objects driving B2B sales. Historically, the primary conduit for revenue orchestration has been the Marketing Qualified Lead (MQL). However, the MQL is inherently flawed because it attempts to model complex, multi-million-dollar B2B purchases around isolated individuals, acting as though a single person buys enterprise software.
In response to the obvious failure of the MQL, the industry transitioned to the Marketing Qualified Account (MQA), heavily influenced by early ABM strategies. While aggregating signals to the account level is mathematically necessary for scoring, treating the account as the purchasing entity is equally fallacious. Corporate entities, as legal structures, do not sign contracts; buying groups composed of humans do.
The definitive evolution in the modern revenue engine, heavily codified by Forrester’s B2B Revenue Waterfall framework, is the shift toward an Opportunity-Centric process. This methodology aligns all scoring, intent tracking, and sales workflows around the opportunity object rather than the lead or account object.
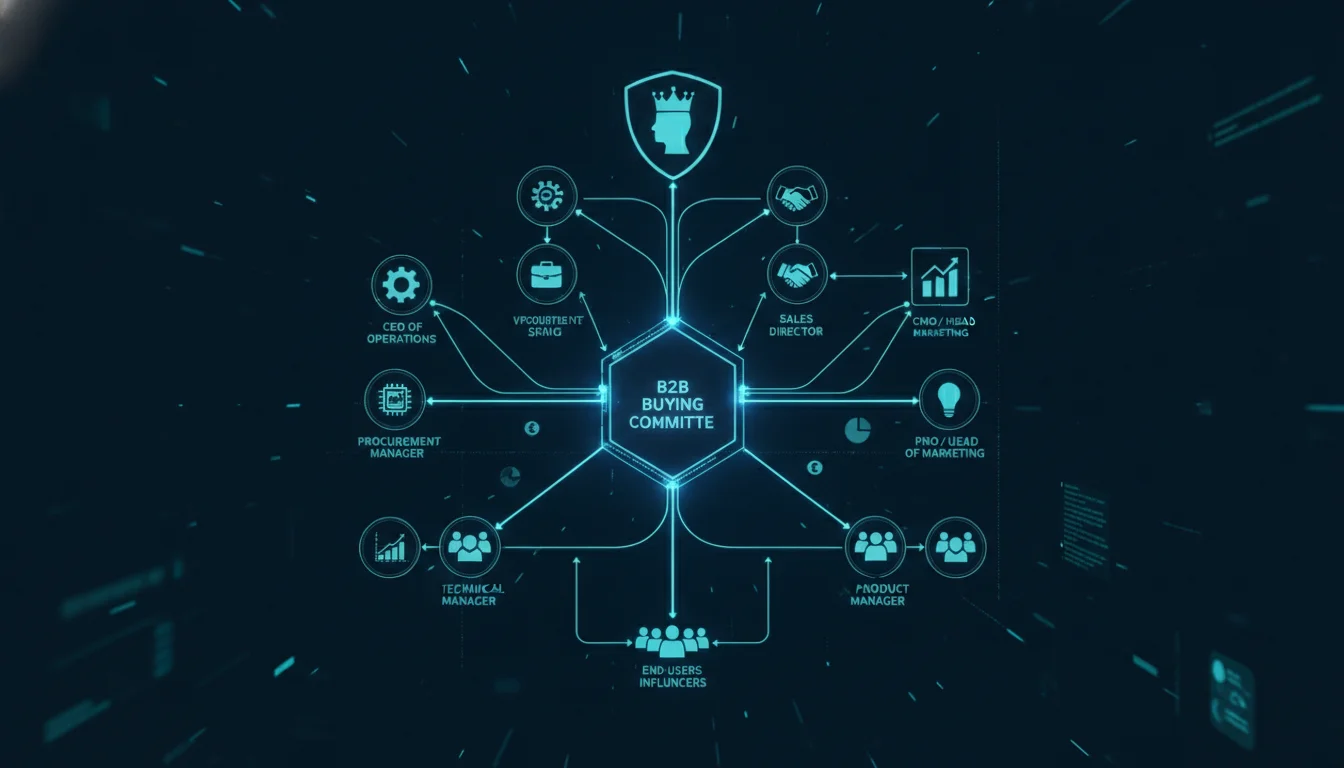
The Architecture of the Buying Group
Major enterprise acquisitions are governed by distributed buying networks consisting of multiple stakeholders, often encompassing 9 to 12 people spanning IT, finance, procurement, and end-users. Each member wields distinct motivations, authority levels, and operational anxieties. The opportunity-centric model maps engagement explicitly against these roles:
- The Champion: Acting as the primary advocate, the Champion possesses the internal credibility to drive consensus for change and acts as the ideal entry point. While they exhibit the highest volume of engagement signals, they rarely hold ultimate financial authority.
- The Decision-Maker: Often insulated from initial marketing outreach, the Decision-Maker commands the budget and has final say. Their intent signals are typically delayed until the final selection phase, scrutinizing business continuity, compliance, and macro-financial ROI.
An opportunity-centric infrastructure acknowledges that when a Champion, a Decision-Maker, and an IT Admin from the same account consume content, they are not three duplicate leads; they are independent verification signals that a coordinated buying group is actively progressing toward a purchase. By attaching all identified members of the buying group to a central opportunity object in the CRM, revenue teams achieve unprecedented contextual clarity. This structural alignment allows marketing algorithms to assess the actual coverage of the buying committee—triggering alerts if a Champion has been highly engaged but the Decision-Maker remains entirely absent from the digital footprint, indicating a high-risk deal.
Platform Ecosystems and GTM Infrastructure
The theoretical execution of these sophisticated scoring and tiering models relies entirely on the technical capabilities of the underlying GTM platform ecosystem.
The market has stratified, with vendors specializing in distinct aspects of the opportunity-centric revenue process.
- ZoomInfo: Recognized primarily for its massive scale, ZoomInfo provides foundational B2B contact and company data, boasting over 260 million professional profiles. While it offers basic buyer intent tracking and sales outreach automation, its AI capabilities are geared more toward lead enrichment than deep, predictive account-based insights. It remains the standard for raw data coverage but is often supplemented by specialized orchestration tools.
- 6sense: A dominant force in predictive AI, 6sense focuses on identifying accounts actively in a buying cycle using anonymous intent signals and behavioral tracking. It is highly regarded for its ability to predict buying stages before a form submission occurs, making it uniquely suited for enterprise ABM teams looking to map the buying committee early.
- Demandbase: Contrasting with platforms focused solely on data or intent, Demandbase provides an end-to-end ABM solution that covers the entire sales and marketing funnel. It integrates first and third-party intent, offers highly customizable account scoring frameworks where teams can adjust individual weights without vendor involvement, and excels in cross-channel advertising attribution.
- Landbase: Representing the newest evolution in AI-native GTM tools, Landbase automates the entire workflow through AI agents. It utilizes “agentic search” to translate natural-language queries into dynamic account targeting, evaluating over 1,500 data points per account in real-time, drastically reducing the manual effort required to build and maintain ICP scoring models.
- MadKudu: Specifically designed for PLG motions, MadKudu connects directly to a company’s data warehouse to surface product usage signals. It specializes in identifying true PQLs by determining which specific product events statistically correlate to conversions, bridging the gap between product telemetry and sales prioritization.
| Platform | Core Strength | Primary Capability | Best Use Case |
|---|---|---|---|
| ZoomInfo | Data scale and contact enrichment | Vast contact database; basic intent and outreach automation. | Foundational contact intelligence and broad prospecting. |
| 6sense | Predictive AI and anonymous intent | Uncovering hidden buying cycles; buying committee mapping. | Enterprise ABM focusing on early-stage intent detection. |
| Demandbase | Full-funnel ABM orchestration | Customizable scoring; comprehensive advertising execution. | End-to-end alignment of marketing campaigns and sales execution. |
| Landbase | AI agent workflow automation | Agentic search; real-time multi-dimensional scoring. | Rapid, automated targeting and enrichment with minimal manual setup. |
| MadKudu | Product-led growth (PLG) analytics | Connecting product usage telemetry to sales intent. | Identifying true PQLs in freemium or trial-heavy SaaS models. |
System Maintenance, Calibration, and Future Outlook
Ultimately, even the most sophisticated combination of multi-layered ICP definitions, predictive AI models, and opportunity-centric tracking will experience entropic decay without rigorous, systematic governance. B2B markets are inherently dynamic; macroeconomic headwinds shift relentlessly, new technological paradigms emerge, and competitor positioning evolves rapidly. A static ICP built 18 months ago relies on stale assumptions that no longer reflect the reality of current enterprise budgets.
To prevent score decay, the underlying scoring algorithms and ICP parameters must be subjected to strict, quarterly recalibration protocols. This maintenance involves conducting deep, backward-looking analyses to compare the AI model’s historical predictions against the actual closed-won, closed-lost, and deal size outcomes of the previous quarter. If, upon review, 70% of an organization’s accounts are artificially inflating into the highest “Tier 1” scoring brackets, the threshold parameters are excessively generous and must be mathematically tightened to preserve sales bandwidth.
Furthermore, this maintenance requires constant feedback loops from frontline sales executives. While predictive AI is exceptional at identifying quantitative correlations, human sales reps must be empowered to mark accounts as “not qualified” and feed qualitative friction points—such as unrecorded budget freezes or nuanced competitor lock-ins—back into the CRM to train the models. Regular CRM data audits are mandatory; AI scoring models are wholly dependent on the cleanliness and accuracy of the underlying data, making systemic data hygiene a prerequisite for predictive accuracy.
By continuously synchronizing mathematical scoring models with real-world pipeline realities, encouraging cross-departmental collaboration between marketing, sales, and RevOps, and embracing the opportunity-centric reality of buying groups, B2B organizations secure the operational agility necessary to navigate the macroeconomic turbulence of 2026. This rigorous, data-driven architecture ensures that finite capital and human effort are consistently and exclusively deployed against the highest-probability vectors of profitable growth, transforming the GTM motion from a center of cost into a compounding engine of efficiency.