Page Speed & E-commerce Conversions: Financial Impact
Introduction: The Commoditization of Digital Velocity
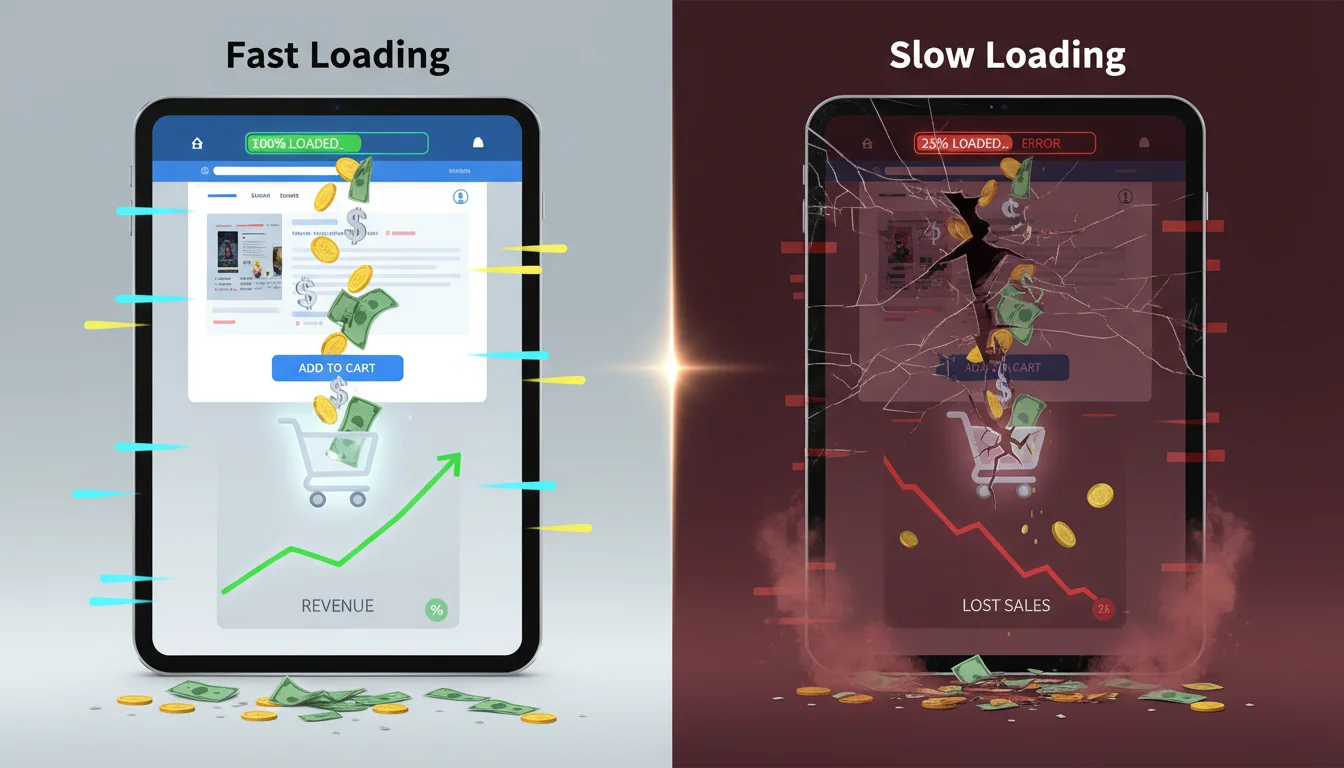
The contemporary digital economy operates on a ruthless paradigm where temporal friction is functionally equivalent to financial loss. In the nascent stages of e-commerce, website performance was largely categorized as a secondary IT operational metric—a measure of server health rather than a primary driver of consumer behavior. However, subsequent decades of longitudinal data, extensive A/B testing, and shifting consumer psychology have reclassified page speed as a fundamental economic lever. The correlation between the millisecond and the profit margin is no longer speculative; it is a proven mathematical certainty governing digital retail.
The empirical consensus indicates that digital consumers evaluate brand competency, product quality, and transactional security within the first few seconds of a digital interaction. When an e-commerce infrastructure introduces latency, it effectively imposes a cognitive tax on the user. This friction manifests initially as a degraded user experience, secondarily as an elevated bounce rate, and ultimately as a severe contraction in top-line revenue. The following analysis systematically deconstructs the relationship between page speed and conversion rates, leveraging historical baselines, rigorous A/B testing case studies, psychological heuristics, and architectural evolutions in web performance optimization as of 2026.
By synthesizing extensive industry data, this exhaustive review provides a granular examination of how micro-delays in content rendering, interactive readiness, and visual stability disrupt the conversion funnel across multiple devices and industry verticals.
The Genesis of Performance Economics: The 100-Millisecond Paradigm
To fully comprehend the current performance ecosystem, one must examine the foundational research that established the financial value of a millisecond. The genesis of modern web performance optimization as a distinct commercial discipline can be traced back to 2006, when Amazon engineers uncovered a profound architectural vulnerability. In transitioning from a monolithic application—where function calls are measured in nanoseconds—to a distributed system of microservices, service calls were suddenly measured in milliseconds. This six-order-of-magnitude degradation meant that pages once loading in 200 milliseconds began taking two seconds or more as backend dependencies compounded.
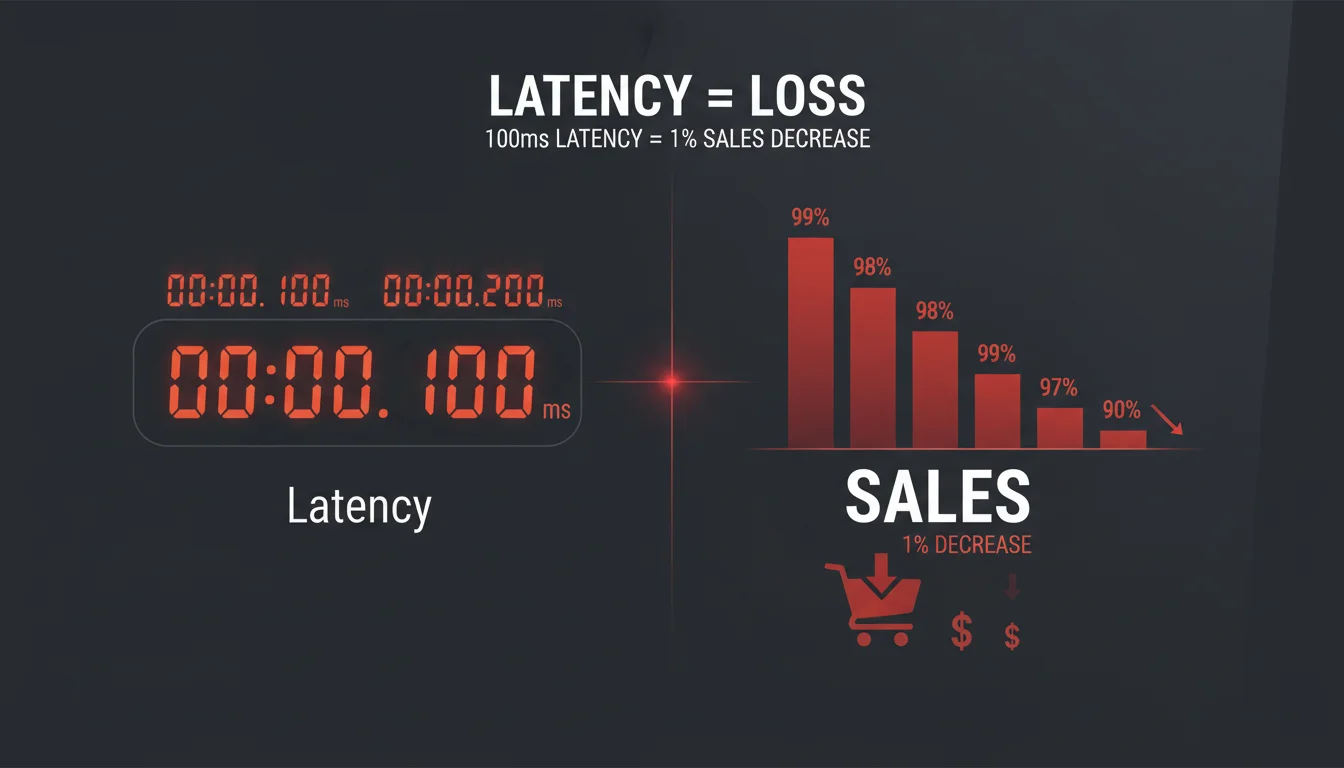
Through rigorous internal A/B testing and performance degradation experiments, Amazon established a metric that would become the industry standard: every 100 milliseconds of added latency resulted in a 1% decrease in sales. To contextualize this financial impact, a 1% loss of annual revenue for Amazon in 2006 equated to approximately $107 million. This accidental discovery regarding the physics of distributed networks forced a fundamental reimagining of cloud computing and data center architecture, cementing the reality that revenue is inextricably linked to digital velocity.
Subsequent large-scale studies have consistently corroborated and expanded upon this 100-millisecond paradigm. Data from Akamai and SOASTA analyzing the state of online retail performance demonstrated that a 100-millisecond delay in website load time depresses conversion rates by 7%. Furthermore, extending that delay to two seconds yields a staggering 103% increase in bounce rates. Concurrent studies presented at the 2009 Velocity Conference by Microsoft and Google further solidified these findings. Bing engineers found that a two-second slowdown fundamentally changed the number of queries executed per user, while Google found that a half-second increase in search result load times dropped both total searches and search revenue by 20%.
The variance between Amazon’s 1% absolute revenue drop and Akamai’s 7% conversion drop per 100 milliseconds highlights a critical second-order dynamic: conversion rate degradation outpaces absolute revenue degradation. This phenomenon suggests that latency disproportionately purges low-intent, marginal, or highly price-sensitive buyers from the funnel first, while absolute loyalists may endure the friction to complete their transaction. Nevertheless, the compounded effect of these micro-delays establishes a definitive ceiling on enterprise growth.
The Taxonomy of Conversion Rate Optimization and A/B Testing Mechanisms
To evaluate the impact of speed on conversion rates, it is necessary to first define the mechanisms of Conversion Rate Optimization (CRO) and A/B testing. CRO is a data-driven discipline focused on continuously improving and enhancing a digital property’s ability to convert passive visitors into active leads or customers. While CRO encompasses a vast array of multivariate elements—including copy, design, and urgency creators—speed operates as the foundational multiplier for all other optimizations. A meticulously designed checkout flow cannot convert a user who abandons the page before the CSS renders.
Modern experimentation frameworks utilize highly sophisticated methodologies to isolate variables. While traditional A/B testing splits traffic equally between a control and a variant, advanced testing techniques deploy sequential testing and bandit algorithms. Sequential approaches optimize resource use by continuously monitoring data and stopping tests early if statistical significance is reached, bypassing traditional Bayesian methods. Bandit algorithms dynamically balance exploration (testing new variants) and exploitation (directing traffic to the winning variant), minimizing the opportunity cost of exposing users to suboptimal experiences during the testing phase.
Furthermore, segment-specific optimization is utilized to uncover insights that might be masked by aggregate data. For example, a global retailer might find that a heavier, media-rich homepage converts well on desktop fiber connections but fails catastrophically on 4G mobile networks, necessitating segment-specific speed optimizations.
The core philosophy of CRO is the elimination of friction. This is evident even in non-speed-related A/B testing case studies. For instance, the e-commerce retailer FSAstock.com suffered from low conversion rates on category pages. By hypothesizing that the navigation bar contained too many distracting elements, they executed an A/B test removing an overwhelming sub-header. The optimized, simplified variant generated a 53.8% increase in revenue per visit. Similarly, the Romanian footwear retailer Modlet discovered via Google Analytics that shoppers who used a shoe size filter made purchases faster because they did not waste time checking out-of-stock inventory. By implementing a persistent size-filtering widget, they removed cognitive friction.
These case studies illustrate that whether the friction is cognitive (complex navigation) or technical (slow load times), the human response is identical: abandonment. Page speed optimization is simply the most mathematically predictable method of removing technical friction.
Macro-Statistical Reality: Global Conversion Baselines
While individual case studies are highly illustrative, macro-analyses encompassing hundreds of millions of sessions provide the definitive statistical boundaries of consumer patience. Global web performance data illustrates a brutal “conversion cliff” that occurs within the first five seconds of a user’s session.
A comprehensive 2022 study by Portent analyzed over 100 million page views across 20 B2B and B2C websites, analyzing 5.6 million user sessions. The findings demonstrated that the difference in conversion rates between blazing-fast sites and modestly quick sites is enormous. A B2C e-commerce site loading in one second has an average goal conversion rate of 39%, representing a conversion rate 2.5 times higher than a site loading in five seconds (which averages roughly 22%). For B2B lead generation websites, the gap is even more severe: a site loading in one second converts three times higher than a five-second site, and five times higher than a ten-second site.
Table 1: The compounded impact of load time on bounce rate and conversion, synthesizing aggregate data from Google, Akamai, and Portent macro-analyses.
| Load Time Threshold | Bounce Rate Impact | Conversion Impact |
|---|---|---|
| 0-1 second | Baseline | Optimal conversion (up to 39% B2C goal rate) |
| 1-2 seconds | +9% | -3.5% |
| 2-3 seconds | +32% | -7.0% |
| 3-5 seconds | +90% | -15.0% |
| 5-10 seconds | +123% | -25.0%+ |
| 10+ seconds | +200%+ | -40.0%+ |
On average, website conversion rates drop by 4.42% with each additional second of load time between zero and five seconds. The highest e-commerce conversion rates universally occur on pages with load times strictly between zero and two seconds. To contextualize this financially: if a one-second page load yields a 3.05% conversion rate generating $1,525 in simulated revenue per block of traffic, degrading that load time to two seconds drops the conversion rate to 1.68%, yielding only $840. A mere one-second slip essentially halves the revenue yield. Further degradation to a three-second load time depresses the conversion rate to 1.12%, yielding $560, and a four-second load time drops the yield to a mere $335.
The 2017 Akamai Online Retail Performance Report, analyzing massive swaths of retail traffic, identified the precise “magic numbers” for maximum conversion realization. The data revealed that the optimal load times to achieve peak conversion rates are 1.8 seconds for desktop environments and 2.7 seconds for mobile environments. Any deviation beyond these thresholds results in exponential performance degradation. Furthermore, the Akamai data established that page slowdowns directly impact session length.
A two-second slowdown on desktop reduced the number of pages viewed by 15.3%, while the same slowdown on mobile reduced session length by an astonishing 51%. Latency effectively kills the user’s desire to browse, eliminating the opportunity for cross-selling and up-selling.
Empirical A/B Testing Case Studies: Artificial Degradation versus Optimization
Observational data regarding site speed and user behavior often suffers from confounding variables; for instance, users on faster corporate fiber networks might inherently possess higher purchasing power than those on slower cellular connections. To isolate speed as the definitive independent variable, leading e-commerce platforms have deployed massive A/B tests and controlled degradation experiments.
The Zalando Artificial Degradation Experiment
Zalando, Europe’s premier online fashion platform, executed a highly controlled experiment to measure the exact elasticity of speed and revenue. Rather than attempting to speed up the site, the engineering team artificially injected latency into their Catalog pages to observe user response in an isolated environment. The testing measured how performance changes affected specific key performance indicators, including bounce rates, conversion rates, and revenue per user session.
The results were unequivocal: higher loading times predictably depressed user engagement, increased bounce rates, and disrupted the conversion funnel. When the company subsequently optimized their architecture, reversing the degradation, they mapped the exact financial recovery. They proved that a 100-millisecond improvement in page load time generated a 0.7% uplift in revenue per session.
Zalando’s optimization strategy provides a masterclass in removing architectural bottlenecks that sabotage conversion. The engineering team achieved a 25% improvement in overall loading time over five months through highly specific backend and frontend interventions. First, by upgrading the React JavaScript framework from version 15.6.1 to 16.2.0, the team shaved over 100 milliseconds off JavaScript execution time.
Second, the team eliminated catastrophic browser reflow bottlenecks. The site previously utilized the react-lazyload library for product images. Because the Catalog page rendered eight products server-side and 76 products client-side, the lazy-loading script triggered a massive, time-consuming reflow of the browser layout for the 76 new items, forcing the browser to constantly recalculate the visual geometry of the page. By stripping out lazy-loading entirely and implementing Low Quality Image Placeholders (LQIP), Zalando avoided these reflows. Similarly, a hidden product filter dropdown was causing reflows via react-virtualized. The team removed the hidden component and delivered crawler links using raw string concatenation outside of React components.
Third, Zalando engaged in aggressive payload compression. By stripping unnecessary properties from backend API JSON arrays used for client-side hydration, page sizes were reduced by 17 KB (gzipped). Concurrently, SVG optimizer protocols (SVGO) were deployed to limit the decimal precision of floating-point coordinates in vector graphics, shrinking icon sizes by 50%. General optimization of libraries and tree-shaking dead code reduced the Header Fragment size by 25%. These granular improvements collectively pushed Zalando to the top of Google’s mobile speed leaderboards, directly driving the 0.7% revenue uplift per 100 milliseconds.
The Walmart Performance Audits
Walmart’s historical performance data provides another critical lens into the relationship between speed and commercial viability. In 2012, Walmart’s internal real user monitoring (RUM) studies utilizing Boomerang.js revealed that average site load times were dramatically lower for the converting population (3.22 seconds) compared to the non-converting population (6.03 seconds). Moving beyond correlation, their A/B testing confirmed that every one second of improvement yielded up to a 2% increase in conversions, and every 100 milliseconds yielded up to a 1% increase in incremental revenue. Furthermore, the study noted significant secondary benefits, including elevated SEO performance for entry pages and drastically reduced abandonment rates.
An independent technical analysis of Walmart’s mobile product pages highlighted how structural load time and perceived load time can violently diverge, ultimately sabotaging A/B testing efforts if not monitored. On specific mobile product pages (such as the Lumia 635 listing), the page structure technically rendered at 2.3 seconds, but the actual text content remained completely invisible until the 3.0-second mark. This phenomenon, known as a Flash of Unstyled Text (FOUT), occurred because custom web fonts blocked the Chrome and Firefox rendering engines. During that 0.7-second gap, the user stared at a blank screen despite the network having delivered the underlying HTML. This visual block interrupts the user’s cognitive momentum, increasing the probability of abandonment long before the “Add to Bag” button is even legible.
Interestingly, Walmart’s CRO teams also conducted UI-based A/B tests on mobile, hypothesizing that a larger “Add to Bag” button would increase purchases. Directing 50% of traffic to the baseline and 50% to the enlarged button resulted in a 12% conversion lift. However, applying such UI optimizations on top of a page suffering from severe FOUT latency means the UI improvements are artificially suppressed, as a percentage of the audience bounces before ever seeing the enlarged button.
Additional Sector Validations
- Vodafone: Through an evenly weighted A/B test comparing two visually and functionally identical landing pages, Vodafone achieved a 31% improvement in the Largest Contentful Paint (LCP) metric on the optimized variant. This strictly performance-based optimization generated an 8% increase in overall sales and a 15% improvement in lead-to-visit rates.
- eBay: By launching a company-wide initiative focused strictly on Above-The-Fold content—measuring Time To First Byte (TTFB) and Time to Above The Fold (TATF)—eBay ruthlessly cut unnecessary rendering path components. The resulting pages loaded 12% faster, which translated to a 0.5% increase in highly valuable “Add to Cart” actions for every 100 milliseconds improved on the search page.
- Pfizer: Dealing with an ecosystem of over 40 brand sites—some taking up to 21 seconds to load—Pfizer instituted a strict “speed budget” for all new images and functionality. This forced operational discipline resulted in sites loading 38% faster on average, which subsequently reduced the aggregate bounce rate by 20%.
Core Web Vitals: The Modern Measurement Paradigm
Historically, web performance was measured by a single, rudimentary event: window.onload. However, this metric proved fundamentally flawed because it failed to account for what the user actually perceived on their screen. A page could technically register as “loaded” in the background while the user stared at a blank white screen due to font-blocking, or a page could appear visually loaded but remain completely unresponsive to taps and clicks because the main thread was locked by heavy JavaScript execution.
Recognizing this disconnect, the industry transitioned to a user-centric performance framework, epitomized by Google’s Core Web Vitals (CWV). These metrics act as a proxy for the actual human experience of digital friction and have become essential ranking factors for search engine algorithms, merging with existing UX signals to form the “Search signals for page experience” update.
The Core Web Vitals encompass three primary dimensions of performance:
- Largest Contentful Paint (LCP): Measures loading performance. It captures the time in seconds from when the page starts loading to when the largest text block or image element is fully rendered within the viewport. The optimal threshold is under 2.5 seconds.
- First Input Delay (FID) / Interaction to Next Paint (INP): Measures interactivity and responsiveness. It calculates the latency in milliseconds from a user’s first interaction (a click or tap) to the moment the browser’s main thread is idle enough to respond to that interaction. The optimal threshold is under 100 milliseconds.
- Cumulative Layout Shift (CLS): Measures visual stability. It generates a cumulative mathematical score of all unexpected layout shifts within the viewport that occur during a page’s entire lifecycle (e.g., a late-loading advertisement pushing text down the screen just as the user attempts to click a button). The optimal threshold is under 0.1.
The direct correlation between Core Web Vitals and commercial outcomes is stark. Blue Triangle analytics have demonstrated that overlaying conversion rate data onto LCP histograms reveals a massive drop-off when LCP slows down. In one particular product page A/B analysis, users converted exactly twice as often with identical content when comparing an LCP cohort of 2.0 seconds versus 5.0 seconds.
This relationship scales globally across diverse digital properties, as documented by official Google developer case studies:
-
AliExpress: The global marketplace optimized its architecture to improve CLS by ten times and doubled its LCP performance.
- This optimization translated to a 10.5% increase in orders, a 27% increase in conversions for new customers, and a 15% reduction in overall bounce rates.
- NDTV: The Indian news and e-commerce hybrid NDTV halved its LCP times, securing a 50% improvement in bounce rates.
- Ameba Manga: By resolving visual instability and improving their CLS score tenfold, the platform increased the number of comics read per session by a factor of two to three.
- Yahoo! Japan: By aggressively fixing CLS issues, the publisher witnessed a 98% reduction in pages rated as “poor” and a subsequent 15% uplift in page views per session, directly increasing ad inventory yield.
- GEDI: The media group saw a 77% reduction in CLS, which correlated with an 8% reduction in bounce rate.
- Flipkart: The Indian e-commerce giant achieved a 2.6% reduction in bounce rate simply by bringing its metrics into compliance with Core Web Vitals thresholds.
- Farfetch: The luxury fashion retailer correlated Core Web Vitals directly with business metrics, proving an increase in key performance indicators that justified the creation of a proprietary Performance Business Case Calculator to prioritize engineering resources.
The third-order implication of Core Web Vitals is profound: because Google utilizes these metrics as an SEO ranking signal, slow sites face a double penalty. First, they fail to convert the traffic they receive. Second, their organic search visibility is artificially depressed, forcing the enterprise to rely more heavily on paid acquisition channels. Consequently, slow page speed actively inflates Customer Acquisition Cost (CAC) while simultaneously depressing Customer Lifetime Value (CLTV).
The Mobile Friction Paradox: High Traffic, Low Intent Realization
The mobile commerce ecosystem presents a fascinating paradox in modern consumer behavior: while mobile devices completely dominate traffic generation, they severely lag in transactional completion.
Industry data from 2024 and 2025 demonstrates that mobile usage accounts for approximately 65% to 70% of global web traffic, yet mobile conversion rates generally hover between 1.2% and 2.9%, depending on the exact vertical. Conversely, desktop conversion rates average roughly 3.9%, meaning desktop traffic converts at approximately 1.7 times the rate of mobile traffic. Furthermore, an analysis by Popupsmart revealed that while mobile and desktop interaction rates with on-site elements are nearly identical (62.17% mobile vs. 60.60% desktop), the ultimate conversion from those interactions is vastly different (34.15% mobile vs. 48.73% desktop).
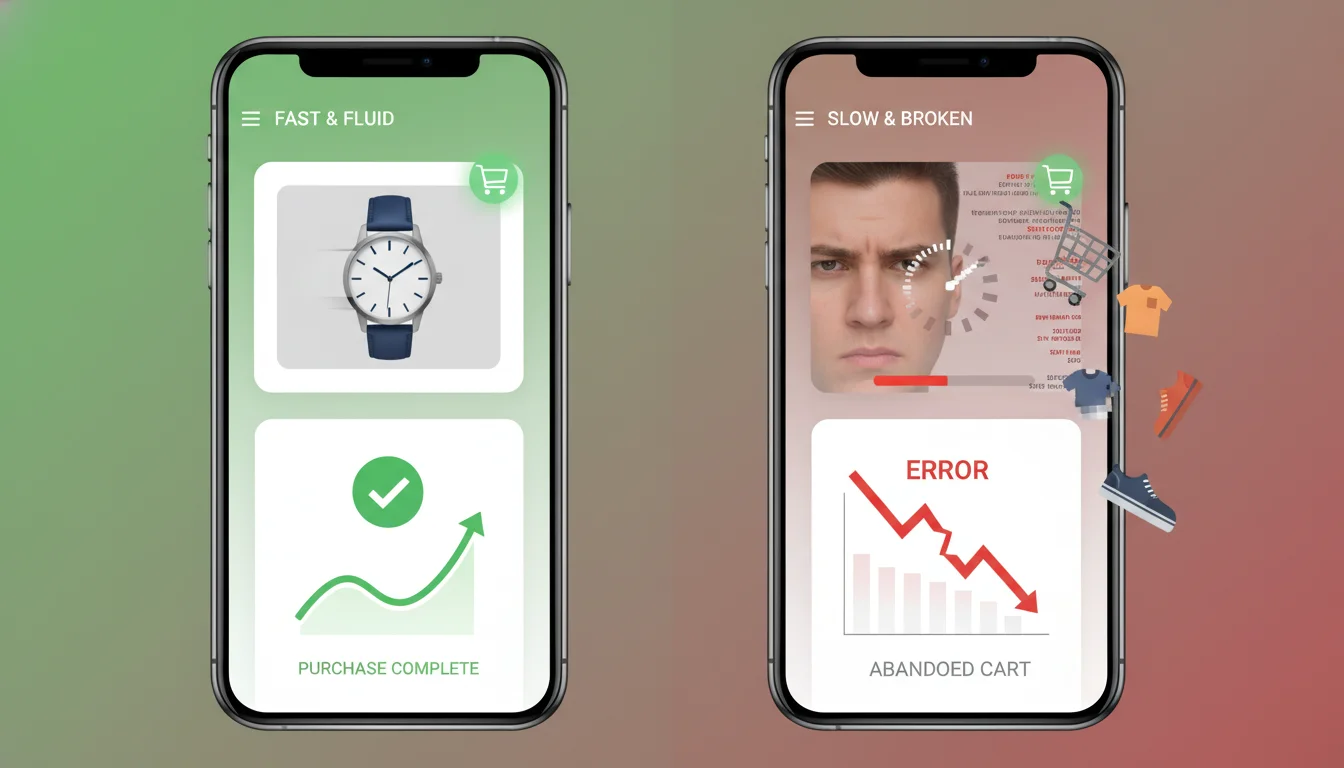
This massive discrepancy is driven heavily by the intersection of user intent, environmental friction, and device performance limitations. Mobile shoppers actually add items to their carts 51.8% more often than desktop users, indicating extremely high initial intent and product interest. They are eager to browse, yet the mobile cart abandonment rate reached an astonishing 83.6% in late 2024, making it 15.3% higher than desktop abandonment.
The primary culprit for this funnel leakage is infrastructural and UX friction. Mobile connections are inherently more variable than broadband, subject to packet loss, cellular network handoffs, and hardware processing limitations. Consequently, the average website in 2025 takes 1.9 seconds to load on a mobile device globally, compared to 1.7 seconds on desktop. Time to First Byte (TTFB)—the speed of the initial server response—averages 0.8 seconds on mobile versus 0.6 seconds on desktop. The First Contentful Paint (FCP) on mobile averages 1.4 seconds compared to 1.2 seconds on desktop.
Because the mobile form factor requires users to navigate smaller viewports, interact with clunky virtual keyboards, and endure slower processing speeds, their tolerance for added network latency is practically nonexistent. A comprehensive Google study analyzing 11 million mobile ad landing pages across 213 countries highlighted the severity of this impatience. The deep neural network analysis found that as mobile page load times increase from one second to three seconds, the probability of the user bouncing increases by 32%. If the load time extends from one second to five seconds, the probability of a bounce jumps by 90%.
Table 2: Comparison of mobile, desktop, and tablet performance constraints and engagement metrics.
| Device Type | Global Traffic Share | Avg. Load Time (LCP) | Avg. Time to First Byte | Avg. Conversion Rate |
|---|---|---|---|---|
| Mobile 📱 | 65% - 70% | 1.8s - 1.9s | 0.8s | ~1.8% - 2.0% |
| Desktop 💻 | 30% - 35% | 1.6s - 1.7s | 0.6s | ~3.9% |
| Tablet 📱 | ~2% | 2.1s - 2.3s | N/A | Variable |
A deep-dive analysis by Deloitte, titled Milliseconds Make Millions, isolated the financial elasticity of mobile speed across 37 global brands in Europe and the US. They discovered that a microscopic 0.1-second natural mobile site speed improvement dramatically improved progression through the entire conversion funnel.
For retail sites, this 0.1-second speedup increased conversions by 8.4% and the Average Order Value (AOV) by 9.2%. For travel sites, the same 0.1-second improvement yielded a 10.1% increase in conversion rates. Consumers are most highly sensitive to speed in the pre-checkout phase; the faster they can cycle through product listing pages and filter items, the less search fatigue they experience, ultimately resulting in larger basket sizes. Conversely, a slow mobile site fundamentally forces the user to buy less, as the act of browsing additional items becomes too painful to endure.
The Psychology of Latency: Perception vs. Reality
To fully grasp why micro-delays cause macro-economic losses, one must move beyond the physical constraints of data packets and examine the neurology of the end user. The way the human brain processes time in digital environments is not objective; it is highly subjective, easily manipulated by environmental cues, and fundamentally conditioned by external technological advancements.
The psychological baseline for instant gratification has continually eroded over the past decade. The “Spillover Timeline,” which tracks consumer patience baselines, shows a dramatic contraction in acceptable wait times, heavily influenced by the speed of algorithmic social media and edge-delivered AI:
Table 3: The Spillover Timeline illustrating the rapid contraction of consumer patience.
| Era | Acceptable Load Time Baseline | Catalyst for Change |
|---|---|---|
| 2020 | 4.2 seconds | Pre-pandemic standard |
| 2021 | 3.8 seconds | Digital immersion due to global lockdowns |
| 2022 | 3.1 seconds | Mass adoption of 5G mobile infrastructure |
| 2023 | 2.6 seconds | Algorithmic, instant-feed content (TikTok normalization) |
| 2024 | 2.2 seconds | Near-instant AI chatbot responses setting new baselines |
| 2025/2026 | 1.9 seconds | The current psychological breaking point |
In the 2025 and 2026 landscape, 47% of users explicitly expect a website to load in under two seconds. Waiting exactly one second allows a user’s natural train of thought to continue uninterrupted. Once a delay crosses into the two-to-three-second territory, the brain recognizes a disruption, inducing a mild stress response comparable to the physiological anxiety of watching a horror film. If a delay pushes beyond ten seconds, complete cognitive disengagement occurs, and the user abandons the task entirely, with 43% of users reporting severe frustration.
However, how a page loads is often more important psychologically than when it actually finishes loading. Unpredictable, stuttering load times cause significantly more frustration than consistent, predictable delays. This psychological insight is the driving force behind modern internet transport protocols like HTTP/3.
HTTP/3 fundamentally alters the transport layer by eliminating “head-of-line blocking”—a legacy TCP network flaw where one lost packet of data would pause the entire queue of loading assets. When head-of-line blocking occurs, the user experiences a page loading in fits and starts (load… pause… load… pause). This stuttering triggers anxiety. By providing consistent interaction timing, HTTP/3 reduces cognitive friction. Benchmark data demonstrates that users adapt far better to a consistent 3-second load than an unpredictable, stuttering 1-to-5 second load.
Furthermore, digital architects now routinely employ “perceived duration” heuristics to trick the user’s brain. For example, skeleton screens (grey boxes showing where content will eventually appear) equipped with a left-to-right shimmer animation are demonstrably superior to screens with a pulsing animation. The human brain equates the smooth motion of a shimmer with continuous progress, while a jerky or aggressive pulse triggers an unconscious “error” or “system stuck” response. Consequently, a 3-second load masked by a smooth shimmer actually feels faster to a user than an objectively quicker 2-second load masked by an aggressive pulse.
Despite these psychological tricks, the core consumer mandate remains ruthlessly utilitarian: 50% of users are willing to completely sacrifice rich media, fancy transitions, and high-definition video animations if it guarantees faster loading. In the hierarchy of user experience design, velocity always supersedes visual complexity.
Sector-Specific Sensitivities: Retail, Luxury, Travel, and B2B Baselines
Fast-Moving Consumer Goods and Retail
Sectors providing essential products or impulse buys demonstrate healthy baselines but severe speed sensitivity.
The food and beverage sector boasts a high average conversion rate of 6.04% to 6.11%, driven by product necessity and subscription models for recurring deliveries. Health and beauty sectors also maintain high baselines, averaging 4.55% to 8.61%. In these high-volume, low-friction sectors, any delay is catastrophic because the barrier to switching to a competitor is practically zero.
Travel and Hospitality
As established by the Deloitte macro-study, travel consumers demonstrate the absolute highest sensitivity to performance improvements. A microscopic 0.1-second improvement yielded a massive 10.1% increase in travel conversions. This extreme sensitivity stems directly from the high cognitive load of booking travel; users are cross-referencing dates, comparing fluctuating prices, and reviewing dynamic maps. Any latency during this high-stakes, multi-tab comparison shopping immediately pushes the exhausted user to an aggregator or competitor’s site.
Luxury E-commerce
The luxury sector presents a unique, opposing dynamic. Luxury fashion brands historically prioritize avant-garde aesthetics, heavy high-definition imagery, and immersive video over utilitarian speed. Consequently, their conversion rates naturally sit lower—often masked under the general Fashion and Apparel baseline of 2.4% to 3.01%. This lower rate is not purely due to speed, but due to high price points that inherently require multiple touchpoints before a purchase is finalized.
However, even in the luxury segment, speed dictates upper-funnel brand engagement. The Deloitte study revealed that a 0.1-second speed improvement led to an 8.6% increase in page views per session for luxury brands. In an industry where visual storytelling builds the brand equity required for a high-ticket conversion, ensuring the user can actually navigate the visual story without buffering is paramount.
Business-to-Business (B2B)
The B2B sector operates on entirely different mechanics. B2B sales cycles are notoriously protracted, involving multiple stakeholders, high contract values, and complex product specifications. As a result, B2B e-commerce conversion rates naturally average a low 2.23% to 2.68%. Breaking this down further, sub-verticals like B2B SaaS convert at an average of 1.1%, Manufacturing at 2.1%, and Commercial Real Estate at 2% to 4%.
Interestingly, while B2B buyers have longer intents and are highly motivated to research a specific software or supply chain solution, B2B digital infrastructure frequently lags behind B2C standards. A 2022 Portent study noted that the average page load speed of B2B sites had not improved over the preceding four years, though 82% of B2B pages did manage to load in 5 seconds or less. Even in this high-intent sector, where users are often contractually bound to use certain portals, the speed penalty remains absolute: B2B lead generation pages loading in one second convert at three times the rate of those loading in five seconds.
Table 4: General conversion rate averages by industry vertical, illustrating the diverse baselines that page speed optimization operates upon.
| Industry Vertical | Average Conversion Rate | Speed Sensitivity / User Intent Profile |
|---|---|---|
| Food and Beverage | 6.04% - 6.11% | High Sensitivity (Impulse/Necessity driven) |
| Health and Beauty | 4.55% - 8.61% | High Sensitivity (Brand loyalty vs low switching cost) |
| Fashion and Apparel | 2.4% - 3.01% | High Sensitivity (High competition/High visual load) |
| Travel & Tourism | ~2.0% - 3.0% | Extreme Sensitivity (+10.1% uplift per 0.1s improvement) |
| B2B Commerce | 2.23% - 2.68% | Moderate Sensitivity (Longer sales cycles) |
| B2B SaaS | ~1.1% | Moderate Sensitivity (High consideration, complex evaluation) |
| Home and Garden | 1.24% - 1.5% | Low Sensitivity (High physical consideration, low impulse) |
Social Commerce and the Algorithm Ecosystem
The impact of latency extends far beyond standalone e-commerce websites; it deeply permeates the social commerce ecosystem, where upstream ad spend must efficiently convert into off-platform sales. Social platforms operate on engagement metrics, and they actively penalize slow downstream sites because off-platform latency ruins the on-platform user experience.
On visual discovery platforms like Pinterest, the journey from inspiration to transaction must be perfectly frictionless. Pinterest’s internal engineering teams recognize this mandate intimately. In 2015, they ran an experiment proving that an architectural rewrite leading to a 60% performance improvement on their own mobile web landing page directly caused a massive 40% increase in signup conversion rates.
In modern advertising ecosystems, brands utilize tools like the Pinterest Conversions API (CAPI) to track the full customer journey in a post-cookie environment. The fidelity of the data passed back to the social algorithm is heavily reliant on speed. Fast, highly integrated tracking mechanisms allow platform algorithms to optimize ad delivery in real-time. Brands utilizing advanced suites like Pinterest Performance+ and Mobile Deep Links —which completely bypass standard, slow web browsers to drop users directly into a native app environment—see dramatic efficiency gains.
Stradivarius, a leading fashion retailer, implemented the Conversions API to measure key actions and saw an 82% boost in purchases attributed to Pinterest, while concurrently lowering their Cost Per Acquisition (CPA) by 28%. The overarching lesson is that off-site latency disrupts the server-to-server algorithmic feedback loops that power modern digital advertising. If a site is slow, the tracking pixel fires late or is abandoned entirely, starving the ad platform of optimization signals and aggressively driving up customer acquisition costs.
Next-Generation Architecture: Headless Commerce and Edge Computing
The escalating consumer demand for sub-two-second load times has pushed traditional, monolithic e-commerce platforms to their architectural breaking point. When an e-commerce platform tightly couples the backend database (inventory, pricing, tax logic) with the frontend presentation layer (HTML, CSS, UI), it creates an inescapable processing bottleneck. Every time a user requests a page, the server must sequentially query the database, assemble the dynamic HTML, and deliver it across the globe.
To circumvent this physical limitation, the industry is rapidly pivoting toward Composable and Headless Commerce architectures. Headless commerce fundamentally separates the frontend presentation layer from the backend business logic and database. By severing this connection, developers can deploy ultra-lightweight, lightning-fast frontends—often built on modern JavaScript frameworks like Next.js or utilizing specialized headless platforms like MedusaJS—that consume backend data via asynchronous APIs only when strictly necessary.
When executed correctly, migrating from a traditional monolith to a headless architecture yields an average conversion rate lift of 12% to 18% based on aggregate 2024–2026 data. This architectural shift is supercharged by the concurrent integration of Edge Computing.
Rather than hosting an e-commerce site on a centralized server in a single data center, edge computing distributes the frontend presentation layer across hundreds of nodes worldwide. When a user accesses a site, the data is processed by an edge server located merely miles away, drastically reducing the physical distance the data must travel. This virtually eliminates initial network latency, slashing Time to First Byte (TTFB) and immediately elevating Core Web Vitals scores for mobile indexing.
Looking toward the remainder of 2026 and beyond, headless architectures are paving the way for the “Agentic CMS”. This represents an evolution from passive generative AI drafting tools into autonomous AI agents functioning as active orchestrators within the content delivery network, dynamically pre-fetching and rendering components based on predictive user behavior. In the hyper-competitive landscape of modern retail, headless commerce paired with edge delivery and predictive rendering is transitioning from a competitive luxury to a baseline requirement for survival.
Conclusion
The vast repository of empirical data, extensive A/B testing methodologies, and macroscopic traffic analyses lead to a singular, undeniable conclusion: page speed is not an IT health metric, but rather the primary economic governor of digital commerce.
The physical reality of latency dictates that every 100-millisecond delay silently erodes user intent. From Amazon’s initial discovery of the 1% revenue loss per 100 milliseconds to Google’s confirmation that extending load times from one to five seconds increases bounce probability by 90%, the mathematical reality remains absolute and unforgiving.
Furthermore, the integration of performance metrics like Core Web Vitals into search engine algorithms ensures that latency carries a severe, compounding penalty. A slow digital architecture simultaneously destroys the conversion rate of existing paid traffic while actively suppressing the acquisition of new organic traffic. The psychological threshold for consumer patience has irreversibly contracted to 1.9 seconds, fueled by an ecosystem of instant-gratification media, predictive AI responses, and normalized 5G cellular connectivity.
To thrive, commercial organizations must abandon the false dichotomy of balancing rich user experiences against technical performance. As demonstrated by the strategic pivots toward Headless Commerce, Edge Computing networks, and HTTP/3 protocol deployment, the infrastructure now exists to deliver highly complex, media-rich experiences instantaneously. In the modern digital economy, cognitive friction is the enemy of revenue, and architectural velocity is the ultimate catalyst for conversion.
E-commerce platforms that fail to internalize the financial gravity of the millisecond will inevitably watch their market share evaporate into the digital ether.