Enterprise SaaS TCO: Calculating the True Cost of Ownership
The True Total Cost of Ownership in Enterprise SaaS: Deconstructing Hidden Fees, API Gateways, and Scalability
Introduction to the Expanded Total Cost of Ownership
The evaluation of enterprise Software-as-a-Service (SaaS) procurement has historically suffered from a systemic financial myopia, wherein procurement teams treat the initial "sticker price" of a software subscription as the primary variable for decision-making. This reductionist approach drastically underestimates the compounding financial obligations required to deploy, integrate, maintain, and scale the system over its useful life. As modern organizations scale their digital infrastructure—particularly as user bases grow past critical inflection points like 1,000 active employees or platform members—the financial paradigm of SaaS shifts from predictable monthly expenditures to highly volatile, consumption-based operational burdens.
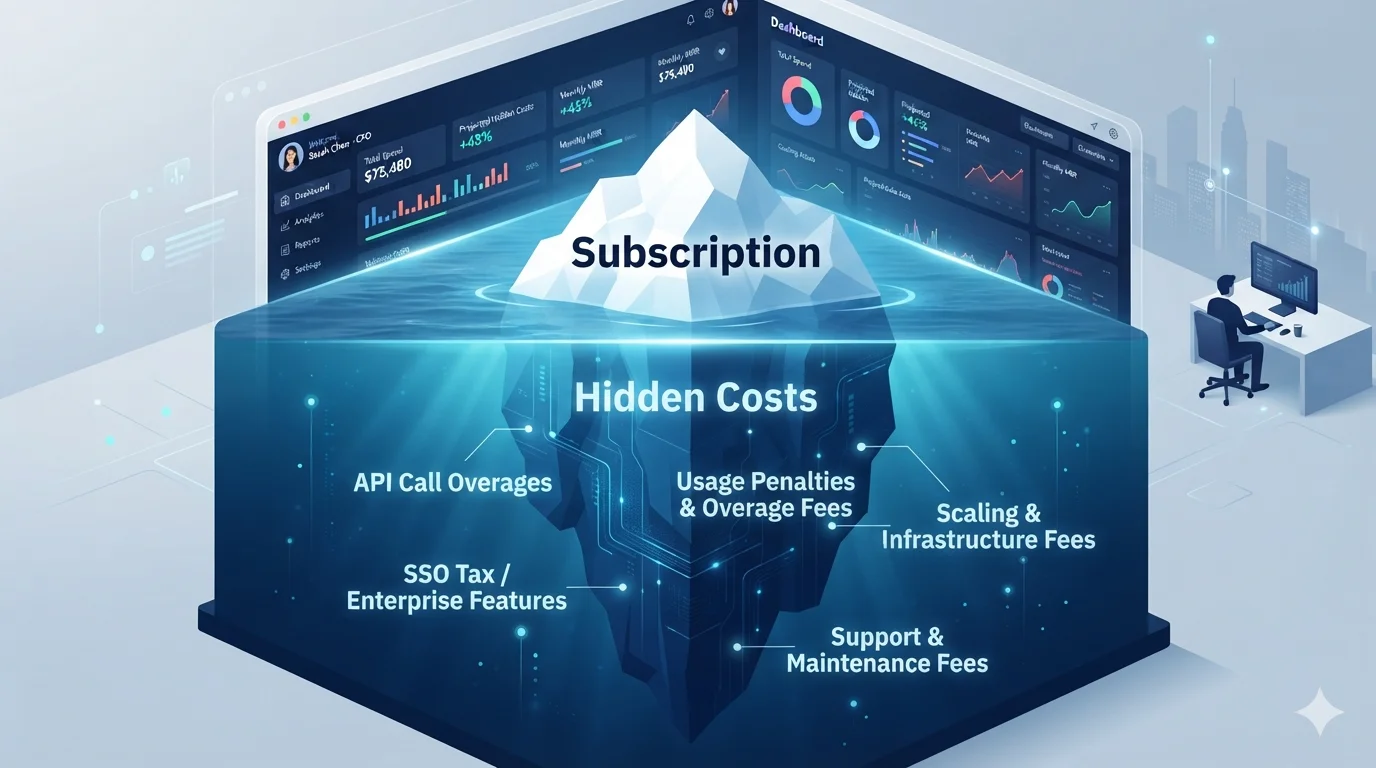
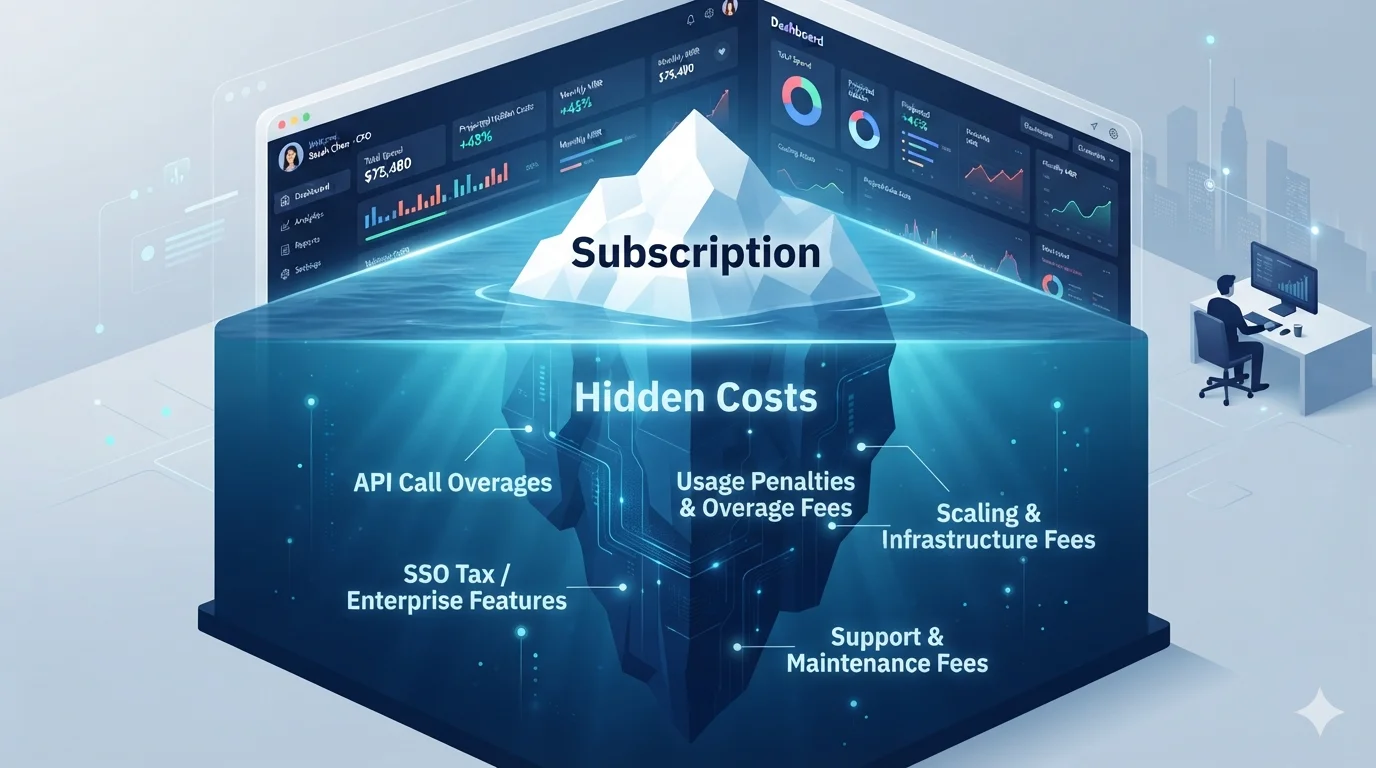
The Total Cost of Ownership (TCO) is a comprehensive financial framework originally pioneered by Gartner in 1986 to address the lack of accountability for the lifecycle costs of decentralizing personal computers. Today, TCO represents the global benchmark for assessing IT expenditures, requiring a holistic calculation of all direct and indirect costs associated with owning and using an asset from acquisition to decommissioning. In the contemporary SaaS landscape, direct costs—such as licensing, cloud infrastructure, and system administration—represent merely the visible tip of the financial iceberg. Indirect costs, which include end-user support, downtime, productivity loss during transition phases, and underutilization, frequently constitute the vast majority of long-term expenditure.
Forrester’s Total Economic Impact (TEI) framework further expands this assessment by analyzing four critical dimensions: costs, benefits, flexibility, and risk. Applying these frameworks reveals that the initial software license often accounts for only 20% to 30% of the total expenditure an organization will absorb over a standard five-year horizon. When a business scales, standard subscription models morph into complex enterprise agreements loaded with punitive "SSO taxes," tiered API rate-limiting penalties, exorbitant data storage overage fees, and mandatory maintenance contracts.
This report provides an exhaustive, nuanced analysis of the hidden financial mechanics within enterprise SaaS. It explores the mathematical modeling of TCO, dissects the realities of implementation and integration sprawl, analyzes the volumetric pricing of remittance API gateways, exposes the punitive nature of enterprise identity management, and deconstructs the architectural and commercial costs of scaling an enterprise user base.
Theoretical Frameworks and Financial Modeling of TCO
Deconstructing Capital and Operational Expenditures
To accurately capture the financial impact of a SaaS deployment, analysts must segment costs into distinct categories, bridging the transition from Capital Expenditures (CAPEX) to Operational Expenditures (OPEX). While the fundamental promise of the SaaS model is to democratize technology by minimizing high initial CAPEX—such as physical server hardware and perpetual software licenses—the reality of enterprise deployments requires significant upfront investments in configuration, integration, and data migration.
Once deployed, ongoing OPEX extends far beyond the monthly or annual subscription fee. It encapsulates premium technical support, continuous training, and the requisite infrastructure costs for hybrid systems, such as bandwidth, cloud storage, and Content Delivery Network (CDN) fees. Furthermore, evaluating SaaS requires precise definitions of recurring revenue and contract values. The Total Contract Value (TCV) encompasses the entire deal, including recurring subscriptions and one-time implementation fees, while the Annual Contract Value (ACV) normalizes only the recurring portion into a single annualized figure. Financial models that rely exclusively on first-year ACV often fall into a forecasting trap, as vendors use heavily discounted initial terms to obscure the compounding TCV over a multi-year lifecycle.
Net Present Value and Internal Rate of Return in SaaS
Mathematical modeling is essential for evaluating long-term SaaS investments, utilizing standard corporate finance methodologies like Net Present Value (NPV) and Internal Rate of Return (IRR). A comprehensive TCO calculation must aggregate all lifecycle costs and discount them to their present value, adjusting for the time value of money and the organization's cost of capital.
The fundamental equation for determining whether a SaaS platform generates or destroys value over its lifecycle relies on the NPV formula. Where:
- represents the net cash flow (quantifiable business benefits minus TCO OPEX) during a single period.
- is the discount rate or the company's required rate of return (hurdle rate).
- is the number of time periods (typically years).
- represents the initial capital outlay, including all implementation and transition costs.
If the NPV of a SaaS investment is negative, the expected rate of return is less than the discount rate. Even if the software generates some operational efficiencies, it fundamentally destroys corporate value. The Internal Rate of Return (IRR) complements this by identifying the exact discount rate at which the NPV equals zero, representing the expected percentage return over the software's useful life.
Second-order insights reveal that procurement teams frequently miscalculate these metrics by failing to factor hidden costs—such as technical debt refactoring, third-party API transaction scaling, and required infrastructure upgrades—into the variables, resulting in artificially inflated return projections.
Comparative Financial Baselines: Cloud vs. On-Premise vs. Open Source
To contextualize SaaS TCO, it must be benchmarked against alternative deployment architectures. The structural differences between proprietary on-premise solutions, cloud-hosted SaaS, and open-source models dramatically alter the allocation of lifecycle costs. Consider a standard enterprise ERP deployment modeled over a three-year horizon for a mid-market organization:
| Cost Component (3-Year Total) | Option A: On-Premise ERP | Option B: Cloud SaaS ERP | Option C: Open-Source + Partner |
|---|---|---|---|
| Licensing / Subscription | $3,000,000 (Perpetual) | $4,766,000 (Subscription) | $1,589,000 (Enterprise Open-Source) |
| Maintenance / Support | $1,800,000 (20% Annual) | $600,000 (Premium Support) | $1,080,000 (Partner Support) |
| Implementation & Config | $5,200,000 | $2,450,000 | $1,950,000 |
| Data Migration & Integration | $2,400,000 | $1,600,000 | $1,200,000 |
| Hosting & Infrastructure | $900,000 (On-Prem Servers) | Included | $600,000 (Cloud Hosting) |
| Training & Productivity Loss | $2,400,000 | $1,660,000 | $1,380,000 |
| Internal IT Staff Allocation | $1,800,000 | $0 (Assumed managed) | $0 (Partner managed) |
| Total 3-Year TCO | $17,500,000 | $11,076,000 | $7,799,000 |
Table 1: Comparative 3-Year TCO Modeling for Enterprise ERP Deployment Architectures.
This baseline demonstrates that while SaaS (Option B) eliminates direct infrastructure and significantly reduces implementation times compared to legacy on-premise systems, it front-loads massive subscription OPEX that scales relentlessly with user headcount. Conversely, open-source models (Option C) structurally reduce TCO by eliminating proprietary license lock-in, though they shift financial risk toward the operational competency of the chosen implementation partner.
The Friction of Deployment: Implementation, Integration, and Sprawl
The Implementation Multiplier
The prevailing commercial narrative that SaaS eliminates deployment friction is a commercial fallacy. In enterprise environments, the cost of implementing and configuring a SaaS application is rarely bundled into the subscription. Instead, implementation fees typically account for 20% to 30% of the first-year subscription cost for standard platforms, and can scale up to 1.5 to 3 times the annual license fee for highly complex, multi-departmental systems.

This implementation multiplier is driven by the necessity of aligning off-the-shelf software with bespoke corporate workflows. Business process re-engineering, specialized vendor project management, and the configuration of custom instances quickly inflate the initial budget. For example, integrating a modern SaaS Accounts Receivable (AR) automation platform with legacy on-premise billing systems or ERPs often requires the development of custom middleware, with each additional system integration costing between $3,000 and $15,000.
Furthermore, data migration remains one of the most consistently underestimated expenses in software transitions. Moving from a legacy system to a modern SaaS CRM requires extensive data cleansing, mapping, and validation. Complex migrations involving dirty data, custom databases, and intricate relational structures routinely cost between $60,000 and $200,000 solely for the migration effort, entirely independent of the software licensing.
The Hidden Costs of SaaS Sprawl and Fragmentation
As organizations scale, they face a strategic architectural choice: adopt unified, "all-in-one" platforms or curate a "best-of-breed" technology stack comprised of highly specialized SaaS applications. While best-of-breed stacks offer superior functionality in isolated domains, they introduce catastrophic TCO inflation through SaaS sprawl.
When business units independently procure SaaS tools without centralized IT governance, the resulting fragmentation requires complex, custom integrations to synchronize data. Research indicates that integration failures occur at a rate of 34% within best-of-breed systems, compared to just 12% for all-in-one platforms.
Furthermore, the maintenance burden in diverse tool environments dramatically inflates costs; maintaining a best-of-breed setup demands 280% more time than an all-in-one platform, draining internal engineering resources and increasing the likelihood of unmanaged application downtime. Consolidating these fragmented applications not only reduces direct licensing overlap but significantly lowers the TCO associated with integration middleware and API maintenance.
Productivity Loss and the Economics of Change Management
Perhaps the most insidious hidden cost of a new enterprise SaaS deployment is the temporary, yet severe, loss of organizational productivity. When an enterprise transitions to a new system, the workforce does not achieve immediate proficiency. Instead, teams experience a transitional period lasting anywhere from two to six months where operational velocity drops significantly as employees navigate new interfaces and workflows. For a mid-sized enterprise, this reduction in output translates to millions of dollars in lost productivity.
The financial impact of this phase must be managed through robust Change Management frameworks. The "7 Rs of Change Management"—ranging from Initial Assessment and Reason to Risk, Return, and Readiness—provide a structured methodology to mitigate these transition costs. Organizations must track critical Key Performance Indicators (KPIs) to quantify this phase, specifically:
- Adoption Rate: The percentage of employees actively using the new tool, indicating behavioral change.
- Time to Adoption: The duration required for employees to reach consistent, baseline usage after rollout.
- Proficiency Levels: The accuracy and speed at which users navigate the new workflows.
Organizations that fail to invest in change management programs extend this productivity trough indefinitely. In best-of-breed SaaS architectures, where employees must constantly context-switch and learn multiple disparate systems, training and onboarding require 144% more hours per new hire compared to unified platforms.
A third-order effect of unmanaged productivity loss is the emergence of "shadow IT." When official enterprise tools are too complex or poorly implemented, employees covertly adopt unauthorized, consumer-grade software to complete their tasks. This negates the ROI of the enterprise SaaS investment and introduces severe data security and compliance risks, ultimately driving up TCO through inevitable incident response efforts and audit failures.
Scaling the API Economy: Transaction Costs and Infrastructure
For enterprise applications that rely on external data or financial processing—particularly those integrating remittance gateways, payment processors, and financial technology (Fintech) infrastructure—Application Programming Interface (API) transaction costs represent a highly volatile vector for TCO inflation. Modern SaaS ecosystems do not exist in isolation; they must programmatically communicate with third-party services. As a user base scales past 1,000 active members, and transaction volumes subsequently explode, the per-call or per-transaction API pricing models utilized by gateway providers can devastate profit margins.
The Anatomy of Remittance and Payment Gateway Pricing
Payment and remittance gateways (e.g., Stripe, Adyen, Braintree, Wise, Nium) utilize opaque, multi-tiered pricing models that combine fixed API call fees, percentage-based transaction models, and hidden foreign exchange (FX) spreads. The selection of a gateway determines how payments are authorized, routed, settled, and reconciled, fundamentally dictating the unit economics of the enterprise platform.
A standard domestic payment API typically advertises a blended rate, such as a percentage (e.g., 2.9%) plus a fixed fee (e.g., $0.30) per successful transaction. However, in the context of global remittance and enterprise operations, these base rates are merely a deceptive starting point.
| Payment Gateway | Standard Domestic Pricing | International / Cross-Border Modifiers | Enterprise Model Availability |
|---|---|---|---|
| Stripe | 2.9% + $0.30 (US) | +1.5% Int'l cards, +1.0% FX conversion | Custom flat-rate / Tiered volume |
| Adyen | Interchange++ | Varies by scheme + €0.10–€0.12 markup | Interchange++ only |
| Braintree | 2.59% + $0.49 (US) | Variable cross-border rates | Custom pricing |
| Wise | Variable by route | 0.4% - 2.0%+ depending on corridor | Volume-based tiering |
| Nium | Custom negotiated | Variable based on Payin/Payout method | Completely custom |
Table 2: Comparative Analysis of Remittance and Payment Gateway Transaction Fees
Cross-border transactions incur compounding assessment fees, often adding 1.5% to 2.0% for international cards, plus an additional 1.0% to 4.49% for currency conversion and FX margins. For high-volume enterprise applications, a flat-rate pricing model becomes an astronomical liability. High-volume merchants typically transition to "Interchange++" pricing models, where the true interchange fee and card network scheme fees are passed through transparently, and the vendor applies a fixed markup (e.g., €0.10 per transaction). While this can reduce costs by 20% to 40% at scale, it introduces immense complexity in financial reconciliation, requiring dedicated accounting personnel to decipher fluctuating network fees.
Furthermore, alternative payment methods and payouts require entirely distinct pricing architectures. Bank transfers (ACH Direct Debit) might be capped at a flat $5.00 per transaction, while programmatic ACH disbursements can cost a flat $0.25, and international wire payouts via APIs can incur flat fees of $8.00 per request.
Beyond the transaction itself, the Fintech API ecosystem is littered with ancillary fees. Identity verification (KYC), AML (Anti-Money Laundering) screening, PCI-compliant card tokenization (vaulting), and advanced machine-learning fraud protection (such as Stripe Radar, which charges ~$0.05 per screened transaction) carry distinct, non-negotiable per-API-call charges.
The Operational Cost of API Rate Limiting and Retry Loops
The technical architecture governing how an enterprise SaaS application communicates with these third-party APIs directly dictates its TCO. API providers uniformly implement rate limiting (throttling) to prevent resource exhaustion, mitigate Distributed Denial of Service (DDoS) attacks, and ensure equitable resource allocation. These limits are enforced through sophisticated algorithms, primarily token buckets, leaky buckets, and sliding windows.
When an enterprise scales, its application will inevitably collide with these API rate limits, receiving HTTP 429 (Too Many Requests) response codes. The financial and operational cost of mismanaging these limits is severe. If an application utilizes a naive "retry-on-error" loop—instantly resending failed requests without respecting the server's Retry-After headers—it will continuously hammer the provider's API. In consumption-based pricing models, these automated, failing requests are still metered, generating massive, unexpected billing overages. The average cost of an API availability incident caused by rate limit failures is estimated to exceed $180,000 per hour for enterprise organizations, driven by system degradation, dropped transactions, and engineering triage.
To mitigate this, enterprise engineering teams must build sophisticated, idempotent architectural patterns. This requires implementing "exponential backoff with jitter" (progressively increasing the wait time between retries while adding randomness to prevent synchronized thundering herds) and circuit breaker patterns (temporarily halting all requests to a failing service to allow it to recover).
The Enterprise API Gateway Paradigm
Developing, testing, and maintaining resilient middleware natively within an application is technically demanding and prone to error. Consequently, enterprises scaling past early growth phases must invest in dedicated API Management Gateways.
Selecting the correct gateway architecture involves navigating another layer of SaaS vendors, each with specific strengths and enterprise licensing costs:
- Kong / Kong Konnect: Offers high performance and a vast plugin ecosystem for rate limiting and transformation, but managed enterprise cloud contracts typically start between $30,000 and $50,000 annually.
- Zuplo: Provides a modern, edge-native gateway tailored for developer experience and easy integration of complex compliance policies (like FAPI 2.0), though it represents a newer ecosystem.
- AWS API Gateway: Features deep integration into the AWS ecosystem with a pay-per-request model, making it ideal for purely cloud-native architectures, though it lacks robust managed developer portals for partner onboarding.
- Apigee (Google Cloud) & IBM API Connect: Legacy enterprise stalwarts offering mature lifecycle management and built-in monetization, but carrying steep learning curves and massive enterprise licensing fees.
Deploying these gateways introduces secondary TCO considerations. Self-hosting an open-source gateway to save on licensing fees expands the organization's PCI DSS audit boundary, forcing internal security teams to manage the underlying infrastructure, databases (e.g., PostgreSQL, Redis), and Kubernetes clusters. Conversely, utilizing managed SaaS gateways transfers the operational burden but locks the organization into high, recurring subscription costs.
Scaling Past 1,000 Users: Identity Governance and the SSO Tax
As an enterprise SaaS deployment crosses the threshold of 1,000 active users, the complexities of user provisioning, access control, and security governance undergo a critical paradigm shift.
Manual onboarding, spreadsheet-based access tracking, and decentralized password management evolve from minor inefficiencies into massive operational liabilities and compliance violations. This scale necessitates the immediate adoption of central Identity Providers (IdPs), Single Sign-On (SSO), Security Assertion Markup Language (SAML), and System for Cross-domain Identity Management (SCIM) protocols. It is precisely at this scaling inflection point that SaaS vendors levy one of the most predatory hidden costs in the industry: the "SSO Tax."
The Economics of the SSO Tax
The SSO Tax refers to the pervasive commercial practice wherein SaaS vendors deliberately restrict essential security features—specifically SAML-based SSO and automated SCIM provisioning—to their highest-tier enterprise subscription plans. A vendor may offer a fully functional standard product at $15 per user per month, but require a mandatory upgrade to a custom-quoted "Enterprise" tier at $45 to $100 per user per month solely to unlock the ability to integrate with the client's corporate identity provider.

This practice effectively penalizes organizations for attempting to secure their perimeters. Data indicates that the average cost of an SSO-enabled SaaS license is approximately 315% higher than the equivalent non-SSO-enabled license. The markup on specific enterprise platforms can be staggering:
- Sanity.io: Base Price $15 | Enterprise / SSO Price $1,514 (Minimum commitment) | Effective SSO Tax Markup: 9,993%
- HubSpot Marketing: Base Price $46 | Enterprise / SSO Price $3,647 (Minimum commitment) | Effective SSO Tax Markup: 7,828%
- Retool: Base Price $5 | Enterprise / SSO Price ~$216 ($60k base + user fees) | Effective SSO Tax Markup: 4,221%
- Vimeo: Base Price $20 | Enterprise / SSO Price $833 ($10,000 minimum) | Effective SSO Tax Markup: 4,067%
- Bluebeam: Base Price $20 (approx, $240/yr) | Enterprise / SSO Price $2,400/yr (100 seat minimum) | Effective SSO Tax Markup: 900%
Table 3: Examples of the "SSO Tax" Markup Across Prominent SaaS Vendors.
For an organization scaling past 1,000 users, this multiplier destroys original TCO projections. A piece of software originally budgeted at $180,000 annually instantly inflates to over $500,000 annually simply to comply with internal infosec mandates that require centralized authentication.
The Compounding Cost of the Identity Provider
In addition to paying the SSO Tax to individual software vendors, the enterprise must also fund the central Identity and Access Management (IAM) infrastructure itself. Evaluating IAM platforms like Okta, Microsoft Entra ID, and Ping Identity reveals complex, modular pricing models designed to expand TCO.
While entry-level IAM rates appear commoditized (e.g., Okta Starter at $6 per user per month, or Ping Identity at $3), enterprise environments require advanced capabilities: full lifecycle management, identity governance, adaptive multi-factor authentication (MFA), and API access management. Okta, for instance, licenses Single Sign-On, Adaptive MFA, Universal Directory, and Lifecycle Management as separable line items, quickly pushing the effective enterprise cost to $17 or more per user per month.
Conversely, Microsoft Entra ID Free ships with baseline Microsoft 365 subscriptions, and Entra P2 is bundled within the premium Microsoft 365 E5 license. However, the hidden catch is that advanced identity governance—required for access reviews and entitlement management—is excluded from E5 and requires an additional Entra ID Governance add-on at $7 per user per month. A fully populated identity stack for 1,000 users can effortlessly cost between $300,000 and $500,000 per year.
The Manifestation of the "Access Tax"
The profound second-order effect of the SSO tax, combined with high IdP licensing costs, is the creation of an invisible operational burden known as the "Access Tax." Because it is financially ruinous to upgrade every single SaaS application in the corporate portfolio to the SSO-enabled enterprise tier, IT departments are forced to perform triage. They selectively enforce SSO and SCIM provisioning only on highly critical platforms (the top 20% of applications). The remaining "long tail" of applications (the other 80%) is left outside the automated governance perimeter.
This partial coverage creates a massive, unbudgeted operational drain. IT personnel must manually provision accounts, track role changes across spreadsheets, and perform tedious access reviews across dozens of disconnected platforms.
When an employee departs the organization, their central SSO access is revoked immediately, but their individual local accounts in the ungoverned applications remain entirely active. This dynamic creates orphaned accounts that accumulate silently over time. At normal corporate turnover rates, organizations accumulate these orphaned accounts faster than manual cleanup processes can address them. Each orphaned account is a vulnerability an attacker can exploit, a license seat being billed for an inactive user, and an inevitable audit finding—all of which continuously inflate the true, unrecognized TCO of the software estate.
Data Storage Overages and Sandbox Environments
As enterprise systems achieve deep integration and ingest vast quantities of historical and operational data, the cost of data storage evolves into a critical, yet frequently underestimated, component of long-term TCO. Unlike modern cloud object storage platforms (e.g., Amazon S3 or Azure Blob Storage), which have commoditized storage to fractions of a cent, enterprise SaaS applications price storage at exorbitant premiums because it is intrinsically tied to high-performance database indexing and proprietary application metadata architectures.
The CRM Data Trap
Salesforce and similar enterprise CRM/ERP platforms provide a stark example of structural storage cost inflation. Standard enterprise licenses generally include a highly constrained baseline of data storage (e.g., 10 GB per organization, plus a marginal allowance per user). As a company scales, automated workflows, email integrations, customer interactions, and high-volume compliance logging rapidly consume this meager allotment.
Once the limit is breached, data storage overage charges are applied automatically. In the case of Salesforce, overage blocks are frequently billed at roughly $125 per month for just 500 MB, equating to approximately $250 per gigabyte per month. To contextualize this penalty, $250 per GB per month is roughly 10,000 times more expensive than storing the equivalent data in an AWS S3 Standard bucket, which costs approximately $0.023 per GB per month.
A mid-market enterprise generating 100 GB of excess transactional data and file attachments (PDFs, call recordings, integration logs) can unexpectedly incur $300,000 in unbudgeted annual data storage penalties. The third-order implication of this pricing structure is severe operational degradation. As CRM databases bloat with legacy compliance records that are rarely accessed, fundamental search queries slow down, reporting becomes sluggish, and critical sandbox refresh times extend from hours to days.
To mitigate these costs, organizations must engineer bespoke archiving architectures. Implementing direct integrations to offload "cold" data to AWS S3, or procuring purpose-built archiving middleware, is technically demanding and shifts costs from OPEX to CAPEX. Archiving is distinct from backing up; archiving removes the data from the expensive production database while preserving referential integrity and audit trails, whereas backups merely create external copies for disaster recovery while the original data continues to accrue premium storage fees. The TCO calculation must therefore explicitly model either the punitive vendor overage fees or the architectural costs associated with designing, building, and maintaining a robust data archiving pipeline.
The Hidden Cost of Staging and Sandboxing
Enterprise software cannot be developed, customized, or tested directly in a live production environment. Scaling organizations require dedicated staging, testing, and "sandbox" environments to validate system updates, test delicate API integrations, and train new users safely without corrupting live data.
However, full-scale sandbox environments that accurately mirror production data structures are rarely provided gratis. In sophisticated ERP ecosystems like Oracle NetSuite, acquiring a premium sandbox environment can add thousands of dollars to the monthly subscription. Furthermore, backup and disaster recovery solutions applied to these environments carry cascading licensing requirements. Enterprise backup platforms routinely charge premium per-user (e.g., $3.60 to $4.50 per user/month for M365 or Salesforce) or per-terabyte rates that must be applied to both the production and the sandbox environments simultaneously to ensure compliance.
Security infrastructure experiences similar duplication. Deploying an advanced threat detection sandbox to analyze malicious payloads requires discrete hardware appliances, PaaS bundles, or nested VM licenses. As an enterprise expands its SOC (Security Operations Center), scaling from a mid-market appliance to a high-throughput enterprise model requires distinct licensing for every node and operating system involved. Failure to account for the duplication of software, security, and backup licensing fees across non-production environments is a pervasive error in preliminary TCO forecasting.
The Annuity of Vendor Lock-in: Mandatory Maintenance Contracts
As an enterprise SaaS deployment matures and the disruptive implementation phase concludes, the financial burden transitions toward long-term maintenance and support contracts.
While the theoretical SaaS model bundles maintenance into the core subscription, large-scale enterprise platforms—particularly those with hybrid architectures, single-tenant dedicated instances, or legacy codebases ported to the cloud—often unbundle these services into separate, unavoidable, and highly lucrative line items.
Historically, on-premise enterprise software vendors charged annual maintenance fees equating to 20% to 25% of the net perpetual license price. Under this model, an organization essentially repurchases the software entirely every four to five years solely through maintenance fees. This commercial model has been smoothly adapted into the cloud era under the guise of mandatory "Enterprise Support" tiers. For instance, major enterprise vendors routinely enforce a baseline enterprise support plan priced at an additional 22% of the net subscription value.
These fees are characterized as highly profitable annuities for vendors. Analysts note that these contracts often generate 60% to 80% margins by year four or five, because the actual engineering cost of delivering patches, regulatory updates, and basic bug fixes diminishes significantly as the software stabilizes. Industry surveys suggest that a fair value for baseline enterprise software maintenance should fall below 16%, yet organizations routinely pay upwards of 26%.
The profound second-order consequence of these maintenance contracts is absolute vendor lock-in. Once an enterprise integrates its core operations into a specific platform, exiting the ecosystem becomes financially and operationally catastrophic. Exit costs—which include extracting proprietary data formats, re-training the workforce, and rebuilding complex API integrations for a replacement platform—can equal 50% to 100% of the original implementation cost.
Knowing the prohibitive nature of these exit costs, vendors maintain inelastic maintenance pricing. Enterprises are forced into a state of continuous compliance with annual price escalations. Failure to pay these premiums typically results in the immediate deprecation of SLA guarantees, loss of access to critical security patches, and the cessation of technical support, leaving the organization exposed to operational downtime and unmitigated cyber risk. To optimize long-term TCO, procurement teams must aggressively benchmark these maintenance rates prior to signing the initial contract, challenge the maintenance base after license true-ups, and negotiate strict, contractual caps on annual escalation rates. Without an annual escalation ceiling, vendors possess the unilateral ability to inflate the TCO exponentially.
Advanced TCO Mathematical Modeling and Forecasting Metrics
To synthesize these disparate cost vectors—from implementation multipliers and API rate limits to the SSO tax, data overages, and maintenance escalations—financial analysts must construct advanced, dynamic TCO models that accurately project cash flows over a standard five- to seven-year lifecycle. The most fatal error in SaaS procurement is performing a static, linear calculation based solely on Year 1 user counts. A rigorous TCO model applies compounded annual growth rates (CAGR) to the user base, data volumes, and API transaction velocity.
An exhaustive TCO algorithm must parameterize the following variables:
- Acquisition & Licensing (Year 1 to Year ): Base subscription costs multiplied by user growth projections, explicitly factoring in forced tier upgrades (the SSO tax) triggered when the organization reaches maturity milestones.
- Implementation & Transition (Year 1): Software configuration, integration middleware development, API gateway setup, and complex data migration costs.
- Productivity Drag (Year 1): A quantifiable metric representing the localized drop in revenue or output during the 2-6 month onboarding phase.
- API Consumption (Variable): Modeled dynamically as transaction volumes scale against tiered rate cards, factoring in FX margins and Interchange++ scheme fees.
- Data Storage Inflation (Variable): Projected data accumulation minus the included platform allowance, multiplied by the vendor's per-GB overage rate.
- Maintenance & Escrow (Year 2 to Year ): Mandatory enterprise support percentages incorporating pre-negotiated annual price escalation caps.
- Decommissioning & Exit Costs (Year ): The projected cost of data extraction, archival, and vendor decoupling at the end of the contract lifecycle.
Furthermore, evaluating TCO within the broader context of SaaS company health metrics requires aligning these expenditures with macro-level performance indicators. High internal SaaS TCO directly impacts the organization's own Customer Acquisition Cost (CAC) Payback Period, Gross Revenue Retention (GRR), and the Rule of 40 (which dictates that growth rate plus profit margin should exceed 40%). If the internal tools required to service a customer are too expensive, the Blended CAC Ratio worsens, undermining the sustainable growth of the enterprise.
Conclusion
The transition from localized software deployments to sprawling, cloud-hosted SaaS architectures has fundamentally obscured the true cost of technology ownership behind layers of opaque pricing models, consumption-based usage limits, and punitive architectural taxes. The initial subscription price, often aggressively discounted to secure the Annual Contract Value (ACV), is a vastly inadequate metric for strategic financial planning.
As an organization scales past 1,000 active users, the mathematical realities of the SaaS model shift aggressively in favor of the vendor. The imposition of the "SSO Tax" forces enterprises into exorbitant premium tiers merely to secure their infrastructure. The natural accumulation of historical data triggers draconian storage overage fees, transforming routine record-keeping into a massive financial liability. In fintech and data-heavy environments, reliance on third-party API gateways—compounded by rate-limiting infrastructure costs, cross-border FX spreads, and opaque transaction fees—can quickly become the dominant line item in the IT budget.
To navigate this hostile commercial landscape, procurement and IT leadership must abandon simplistic, linear pricing comparisons. Organizations must adopt rigorous, multi-variable Total Cost of Ownership (TCO) modeling. By quantifying indirect costs like productivity loss, forecasting volumetric API and data growth, accounting for the duplication of non-production environments, and pre-negotiating maintenance escalations before vendor lock-in takes effect, enterprises can reclaim commercial leverage. Treating software acquisition not as a commoditized, one-time subscription, but as a complex, multi-year financial ecosystem is the only methodology that ensures technology investments drive genuine, sustainable business value.