Discovering Pre-Breakout Trends: AI, Virality & GEO 2026
Predictive Content Discovery: Architecting Trend Origination in the 2026 Digital Ecosystem

The Strategic Imperative of Predictive Virality
In the rapidly accelerating digital ecosystem of 2026, the mechanics of content discovery and trend origination have undergone a fundamental paradigm shift. Historically, market research, content strategy, and digital marketing relied almost exclusively on retrospective data architecture. Organizations would analyze historical search volumes, trailing social engagements, and past consumer behaviors to plan future campaigns. While this retrospective methodology remains foundational for establishing baseline market understanding, it categorically fails to capture immediate, highly volatile demand spikes. This lag leaves organizations in a reactive posture, responding to cultural phenomena only after mass saturation has occurred and the associated commercial value has been deeply diluted. The modern strategic imperative has therefore shifted toward “predictive virality,” defined as the structural capability to identify, quantify, and leverage micro-trends during their nascent stages of acceleration.
At the core of this transformation is the critical imperative to distinguish between short-lived fads and enduring cultural trends. Trends possess deep staying power; they slowly gain widespread momentum and reflect the underlying evolution of society, culture, and fundamental consumer values. Fads, conversely, are contained bursts of hyper-activity driven by novelty, social pressure, and immediate gratification, often fading as quickly as they emerge into the digital consciousness. An effective heuristic for distinguishing the two is evaluating the structural foundation of the observed behavior. For instance, a macro-shift toward holistic wellness and longevity represents an enduring cultural trend, whereas a highly specific, viral dietary challenge propagating across TikTok represents a transient fad. For commercial entities, failing to differentiate between the two can result in catastrophic misallocations of capital, oversaturated market positioning, and diluted brand equity. This dynamic has been historically evidenced by massive market overcorrections in sectors such as soft-serve frozen yogurt and juice bars, where initial hyper-growth masked an unsustainable fad lacking long-term trend fundamentals.
The widespread integration of Artificial Intelligence (AI) and machine learning has further complicated, expedited, and formalized this landscape. In 2026, Generative AI is no longer merely an experimental tool for automated execution; it functions as a core strategic layer for performance optimization, behavioral analysis, and real-time campaign refinement. Data indicates that hyper-personalization is now the definitive standard in digital marketing, with 75% of consumers exhibiting a higher likelihood of purchasing from brands that deliver personalized content, leading 48% of marketing leaders to exceed their revenue goals through these strategies. Consequently, roughly 75% of brands have deeply incorporated Generative AI into their overarching strategic frameworks. Recent industry surveys confirm that organizational transformation driven by AI is unparalleled, with the focus of Generative AI usage shifting aggressively from backend efficiency and cost-saving (cited by 70% of organizations previously) toward delivering measurable improvements in front-end marketing effectiveness. As AI agents and Large Language Models (LLMs) synthesize vast amounts of unstructured information to provide conversational answers, the underlying architecture of search is evolving from traditional keyword optimization into Generative Engine Optimization (GEO).
To capture demand within this AI-first paradigm, organizations are increasingly forced to prioritize “content velocity”—the speed at which high-quality, relevant content is deployed to fill emerging information voids before competitors or algorithms can react. The most effective intelligence teams combine this high-velocity execution with rigorous data architecture, blending automated pattern recognition with human strategic judgment to detect weak signals long before they reach their peak visibility.
Theoretical Frameworks of Cultural Evolution
Cultural Materialism and the Trajectory of Change
To forecast trends accurately and engineer content discovery, one must first understand the sociological mechanisms through which culture itself evolves. The theoretical framework of cultural materialism, pioneered by Welsh literary scholar and Marxist cultural critic Raymond Williams, provides a robust structural model for analyzing the shifting ideologies and aesthetic preferences of consumer populations. Williams conceptualizes culture not as a static, monolithic entity, but as a continuous, active negotiation and socio-political struggle between three distinct forces: the dominant, the residual, and the emergent.
The “dominant” culture represents the overarching ideologies, values, and practices held by the societal majority; it oversees the status quo and dictates the mainstream commercial market. “Residual” cultures consist of older traditions, historical practices, and past customs that continue to influence the present, often merging seamlessly into new environments or operating subconsciously within consumer decision-making. Crucially for the discipline of predictive trend forecasting, the “emergent” culture encompasses entirely new values, aesthetics, and social relationships that develop on the fringes of society, frequently in direct opposition to, or distinct from, the dominant cultural framework.
It is a common misconception to view these three categories simply as past, present, and future; rather, in Williams’ formulation, residual, dominant, and emergent forces all operate simultaneously within contemporary culture. In the modern digital sphere, emergent cultures incubate rapidly within niche subcultures, private messaging groups, and isolated algorithmic clusters on platforms like TikTok and Reddit. As these emergent behaviors gain algorithmic traction, they begin to challenge the dominant culture. The friction between the emergent and the dominant is the fundamental engine of trend origination. Advanced trend detection methodologies seek to isolate these emergent signals while they are still confined to the fringe, quantitatively tracking their gradual incorporation into the dominant mainstream.
The Diffusion of Innovation in Digital Networks
The precise movement of a trend from the emergent fringe to the dominant mainstream is governed by the Diffusion of Innovation (DOI) theory, first conceptualized by Gabriel Tarde in 1903, expanded by Ryan and Gross in 1943, and formally popularized by Everett Rogers in 1962. The DOI model maps the adoption of new ideas across a social system in a distinct S-shaped adoption curve, categorizing consumers into five temporal cohorts based on their psychological propensity for risk and novelty: Innovators, Early Adopters, Early Majority, Late Majority, and Laggards.
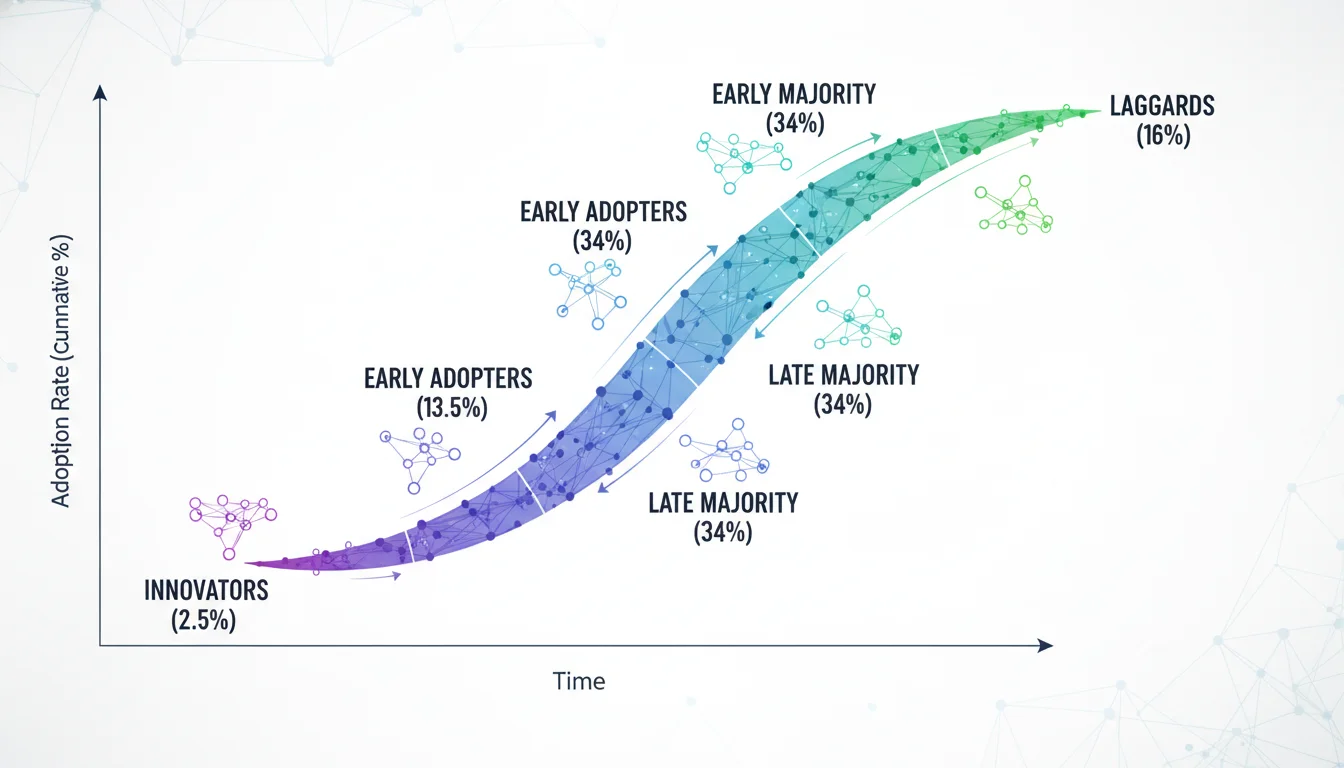
In the contemporary context of digital content discovery, the rate at which an emergent trend traverses this curve is heavily influenced by five perceived attributes of the innovation:
- Relative Advantage: The degree to which the new trend, aesthetic, or format is perceived as superior to the idea it supersedes.
- Compatibility: The alignment of the trend with the existing cultural values, past experiences, and practical needs of the prospective adopters.
- Complexity: The perceived difficulty of understanding, participating in, or replicating the trend.
- Trialability: The ability for users to experiment with the trend on a restricted, low-risk basis (e.g., trying a TikTok audio filter).
- Observability: The visibility of the trend’s outcomes to others within the social network.
While Rogers’ traditional model relied heavily on interpersonal, peer-to-peer communication and the influence of distinct opinion leaders, the algorithmic architecture of platforms like TikTok and Instagram acts as an unprecedented mass accelerant. The structural social influence emphasized by modern Network Theory combines with algorithmic content distribution to radically compress the timeline of diffusion. Furthermore, the Technology Acceptance Model (TAM) offers a focused cognitive perspective on individual adoption decisions, which, when paired with the DOI framework, explains how a micro-trend can jump from Innovators to the Early Majority in a matter of hours rather than months.
Applied Semiotics and Cultural Mapping
Understanding how a trend spreads mathematically must be paired with a rigorous understanding of what the trend actually signifies to the human psyche. Semiotics—the study of signs, symbols, and their use in communication—provides a cognitive perspective that treats consumer culture as a highly structured sign-symbolic system. In the context of trend forecasting and content discovery, applied semiotics decodes the underlying cultural logic driving shifting behaviors and aesthetic preferences.
A comprehensive semiotic analysis involves dissecting verbal signs (what is said or written), visual signs (what is seen), and the ultimate symbolic message they collectively convey. This discipline requires mapping the relationship between the “signifier” (the physical form a sign takes, such as a piece of clothing, a specific video format, or a brand logo) and the “signified” (the conceptual meaning, cultural weight, or psychological attitude it represents). To map these cultural codes systematically, analysts frequently utilize the Greimas Semiotic Square, a conceptual mapping tool dating back to 1966 that charts the logical relationships between oppositional terms. By plotting semantic oppositions (e.g., active vs. passive, artificial vs.
natural), brands can identify semantic voids and emergent “ruptures” where entirely new trends can take root and differentiate the brand.
In modern visual-centric digital environments, aesthetics act as the primary “bearer of meaning.” Visual semiotics dictate that the aesthetics of a piece of content serve as social information that embodies highly specific lifestyles, tastes, and consumer values. The proliferation of internet “micro-cores” across social platforms (e.g., Barbiecore, Y2K, Quiet Luxury, e-girl/e-boy) demonstrates how visual aesthetics are utilized by younger demographics, such as Gen Z, as vital mediums of self-expression to navigate complex societal anxieties, including economic instability and climate change. However, the hyper-velocity of digital content platforms often strips these visual subcultures of their historical context, leading to a phenomenon where aesthetics are extracted for immediate visual consumption, resulting in “symbolic dilution” and a loss of profound meaning. An effective predictive content strategy must therefore use semiotics to differentiate between a superficial visual aesthetic (a fad prone to rapid decay) and an aesthetic shift backed by profound cultural meaning (a durable trend).
Mathematical Models: Velocity, Volatility, and Decay
Trend forecasting has evolved far beyond qualitative observation; it is now heavily underpinned by statistical physics, econometrics, and differential calculus. The transition from monitoring static search volumes to measuring the complex dynamics of “search velocity” provides organizations with mathematically rigorous leading indicators of breakout potential.
Calculating Keyword Velocity and Acceleration
Standard keyword volume indicates the historical size of a market, but “velocity” indicates the rate of change in consumer demand, offering immediate strategic value. In mathematical terms, if V(t) represents the search volume at time t, the search velocity is the first derivative of the volume with respect to time, calculated as dV/dt. A high, positive first derivative indicates a rapidly accelerating topic. Advanced data analysts frequently compute these numerical derivatives directly within spreadsheet software using specialized functions like DERIVF() to pinpoint the exact inflection points of search data, analogous to identifying the equivalence point on a chemical titration curve. Monitoring this “first derivative growth phase” allows organizations to capture digital demand long before the peak of mass saturation.
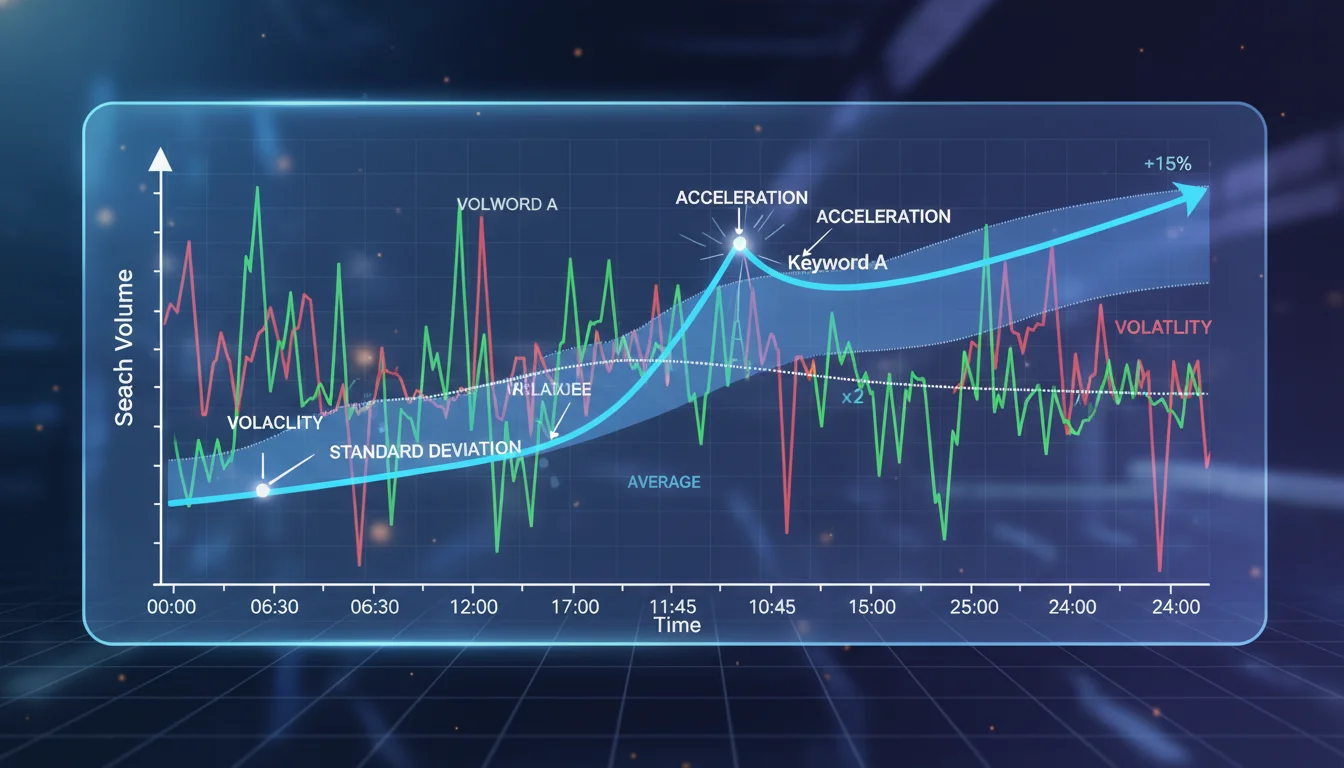
Furthermore, analyzing “acceleration”—the second derivative d2V/dt2—identifies fundamental changes in the growth rate itself. A declining second derivative, even when the overall volume is still increasing, serves as an early warning signal that a trend is approaching its zenith. Predictive analytics platforms often smooth these trajectory visualizations to remove minor daily fluctuations and isolate the true underlying growth curve. The concept of velocity extends directly to commercial outcomes through the Sales Velocity Equation, which transitions from measuring theoretical interest to calculating actionable “revenue-per-month” by optimizing the speed at which leads progress through the conversion funnel. Understanding these metrics is vital when modeling expected traffic, keeping in mind that click-through rates (CTR) decline precipitously based on Search Engine Results Page (SERP) positioning (e.g., Position 1 yields ~30-40% CTR, Position 2 yields ~15-20%, and Position 3 yields ~10-15%).
Volatility Detection via Standard Deviation
Statistical variance and standard deviation are critical for isolating abnormal spikes in search behavior or social engagement from standard market noise. The standard deviation (σ) measures the dispersion of a dataset relative to its mean (μ), formally calculated via the formula:
σ = √[ Σ(xi - μ)2 / N ]
Where xi represents individual data points (such as daily closing prices or search volumes) and N is the total number of periods.
When consumer interest hugs its historical moving average, the standard deviation remains low, indicating a stable, predictable, and potentially stagnant market characterized by low emotion. However, when search volume or engagement data points stray significantly from the simple moving average (SMA), the standard deviation spikes dramatically, signaling heightened volatility, panic, or breakout conviction. Data scientists often apply standard deviation thresholds (e.g., events occurring outside of two standard deviations from the mean) to programmatically flag statistically significant “breakout” anomalies in real-time data streams. Google Trends inherently utilizes proportional scaling and indexing to normalize this data relative to geography and total search volume, officially classifying a topic as a “Breakout” when its search interest grows by more than 5,000% relative to the selected historical benchmark. However, analysts must be wary of algorithmic anomalies; jumping from near-zero search volume to moderate volume can artificially trigger a “breakout” status due to the mathematical implications of dividing by zero, necessitating human review.
Epidemiological Models of Content Decay
Just as mathematical models predict the rise of a trend, they must also quantify its inevitable decay. The lifecycle of a digital trend—initiation, growth, peak, collapse, and extinction—mirrors the propagation dynamics of infectious diseases across a population. Researchers increasingly apply compartmental epidemiological models to digital virality, specifically SEIR (Susceptible, Exposed, Infected, Recovered) and SIS (Susceptible, Infected, Susceptible) models.
The SEIR model is highly effective at capturing the distinct peak lifecycle stages of an explosive, one-time trend, while the SIS model highlights recurrent popularity cycles, illustrating how audiences can become “susceptible” to a trend multiple times, such as with recurring seasonal phenomena.
To quantify the exact rate at which a specific piece of creative content will lose its commercial efficacy over time, predictive frameworks utilize a Creative Decay Score. This is mathematically modeled using an exponential decay function:
E(t) = E0e-kt
Where E(t) is the projected effectiveness at time t, E0 is the initial peak effectiveness score, and k is a composite decay coefficient. This k coefficient is highly dynamic and derived from multiple weighted variable inputs, including the base format decay rate, a saturation factor modeling stylistic overuse, and a competitive pressure coefficient. High-intensity formats, such as short-form video, exhibit rapid viewer fatigue and consequently a high k coefficient, whereas evergreen, highly targeted formats (such as email campaigns) display much slower decay curves.
Machine Learning and Predictive Time-Series Forecasting
To transition from observing historical velocity to projecting future demand, data scientists employ sophisticated multivariate time-series forecasting models. By harvesting real-time query data via application programming interfaces (APIs) and correlating it with external features (such as seasonality, external sales events, or related cross-category purchases), several machine learning algorithms can be trained to predict subsequent search volumes with high fidelity.
Recent empirical studies evaluating the efficacy of these algorithms in e-commerce demand prediction and search count prediction reveal varying degrees of accuracy across different models. Algorithm performance is rigorously evaluated using standard metrics, namely the Coefficient of Determination (R2), Mean Absolute Error (MAE), Mean Squared Error (MSE), and Root Mean Squared Error (RMSE).
Table 1: Performance metrics of multivariate time-series algorithms for digital demand forecasting. Empirical data indicates that Linear Regression provides superior baseline accuracy for generalized trend trajectories, closely followed by XGBoost.
| Predictive Algorithm | R2 Score | MAE | MSE | RMSE | Correlation Coefficient |
|---|---|---|---|---|---|
| Linear Regression | 90.688 | 0.038 | 0.003 | 0.057 | 0.9 |
| XGBoost | 85.890 | 0.042 | 0.004 | 0.062 | 0.9 |
| K-Nearest Neighbor (KNN) | 85.129 | 0.045 | 0.005 | 0.068 | 0.7 |
| Random Forest | 84.854 | 0.041 | 0.004 | 0.066 | 0.6 |
Beyond raw numerical prediction of query counts, natural language processing (NLP) models are increasingly being deployed to predict the underlying context and intent of search behavior. Advanced retail AI systems, such as those detailed in recent algorithmic literature, utilize complex product-query affinity scores to map raw search strings to vast ontological categories. For instance, these systems can predict a specific contextual activity (e.g., “running”) from an ambiguous query (e.g., “Adidas men’s pants”) by analyzing millions of product reviews mapped against 173 context-of-use categories, 112 activities, and 61 audience segments. This technological leap from literal keyword matching to deep contextual intent prediction is foundational for identifying lateral, cross-industry trends.
Trend Aggregation Intelligence: Enterprise Tools and Methodologies
The industrialization of trend spotting has led to the proliferation of commercial market intelligence platforms designed to automate the discovery phase for enterprise clients, transitioning the practice from manual observation to scaled algorithmic detection.
Search-Based Trend Aggregators
Platforms such as Exploding Topics and Glimpse represent the absolute forefront of search-based trend discovery. While standard tools like Google Trends provide raw, relative historical data, they inherently require the user to already know what topic they are looking for.
Exploding Topics circumvents this limitation by utilizing advanced machine learning algorithms to autonomously scrape millions of unstructured data points, categorizing over 1.1 million distinct trends across macro (business, tech) and micro (CPG, AI) categories. The platform identifies terms exhibiting sustained, long-term growth trajectories before they hit the mainstream, providing up to 15 years of historical data to validate the trajectory. Crucially, Exploding Topics combines this algorithmic scraping with rigorous human curation to filter out short-lived fads, media gossip, and noise, focusing exclusively on commercially viable movements.
Glimpse operates as a sophisticated browser extension overlay to Google Trends, systematically converting Google’s relative 0-100 scaling into absolute search volumes. It enriches traditional search data by mapping the broader digital ecosystem, pulling supplementary momentum metrics from social networks to provide a holistic view of consumer interest. Other competitive platforms, such as Treendly, offer predictive growth modeling across multiple distinct data silos—allowing users to separate Google search intent from Amazon purchase intent or YouTube educational intent, which is particularly vital for e-commerce forecasting.
Broad Market and Analytics Platforms
For comprehensive digital market analysis, enterprise marketing software stacks integrate multiple intelligence streams. Tools like Similarweb excel in competitor traffic analysis, ZoomInfo provides B2B market intelligence, AlphaSense utilizes AI for financial market intelligence, and BuzzSumo focuses on social engagement tracking, generating a proprietary “Trending Score” based on immediate social media velocity. In the realm of advanced analytics and attribution, platforms like SegmentStream, Adobe Analytics, and Funnel aggregate marketing data to allow for deep predictive modeling and incrementality testing, moving beyond basic Google Analytics 4 (GA4) capabilities. To generate content based on these trends, AI-driven inbound tools like Scalenut and SE Ranking utilize behavioral automation to recommend perfectly timed content topics.
The Predictive Power of Pinterest
In the realm of visual platforms, Pinterest Predicts has established itself as an extraordinarily accurate forecasting engine. By analyzing billions of searches and the aesthetic content users engage with globally, Pinterest combines machine learning, predictive analytics, and human observation to forecast the coming year’s visual trends. Because Pinterest is inherently a “planning” platform—where users curate ideas, fashion, and home decor months before taking physical action—its data acts as a massive leading indicator of consumer intent. Historical audits reveal that Pinterest Predicts has maintained a remarkable 80% accuracy rate over a multi-year period, with 8 out of 10 called trends coming true, effectively forecasting movements long before they manifest on faster, more reactive platforms.
Platform-Specific Heuristics and Viral Benchmarks
Not all digital engagement carries the same predictive weight. To determine whether a piece of content will initiate a larger cultural trend, analysts must move beyond vanity metrics (such as cumulative follower counts, total lifetime views, or passive likes) and heavily scrutinize velocity and ratio-based engagement metrics.
The Engagement-to-View Ratio (ERV)
On algorithmic recommendation platforms like TikTok, Lemon8, and Instagram Reels, content is aggressively pushed to cold, non-follower audiences via “For You” pages. Therefore, the total volume of likes or shares is significantly less important than the proportion of the audience that actively chose to interact. The viral potential of short-form video content is reliably measured by the Engagement Rate by Views (ERV) formula:
In the highly competitive environment of late 2024 and 2026, the median engagement rate by view on TikTok hovered around 3.4% to 3.85%. Content achieving an ERV above 5% demonstrates strong audience resonance. However, content that truly possesses viral breakout potential—content that will shape broader trends—consistently maintains an ERV between 8% and 10% or higher during its initial hours of distribution.
Table 2: Comparative engagement benchmarks across major digital platforms for 2026, highlighting the specific threshold ratios required to achieve algorithmic acceleration and signal trend formation.
| Digital Platform / Content Format | Baseline Engagement Rate | High-Performance (Viral) Threshold |
|---|---|---|
| TikTok (General Video) | 3.4% - 3.85% | 8.0% - 10.0%+ |
| Instagram (General Posts) | 0.48% | > 2.0% |
| Facebook (General Posts) | 0.15% | > 1.0% |
| YouTube Long-Form (Like-to-View) | 3.0% | 4.0% - 8.0%+ |
| YouTube Shorts (Like-to-View) | 2.0% | 3.0% - 6.0%+ |
Velocity, Retention, and Intent Signals
Algorithmic favor is heavily dependent on “view velocity”—the percentage of total views accumulated within the first 24 hours of publication compared to historical baselines. A steep velocity curve indicates that the platform’s machine learning infrastructure has identified strong user satisfaction signals and is aggressively syndicating the content to broader cohorts.
Furthermore, “save-to-view” ratios and audience retention curves serve as high-fidelity proxies for content quality and resonance. On platforms like YouTube, a retention curve that successfully holds 60% of its audience through to the end of the video strongly signals to the algorithm that the video fulfills the viewer’s intent, warranting further recommendation. Conversely, a sharp drop-off of 70% of viewers within the first 30 seconds guarantees rapid algorithmic suppression. Marketers must also meticulously track specific conversion signals hidden within engagement, such as the ratio of subscribers gained per 1,000 views, or trackable outbound clicks to external resources (facilitated by precise UTM link tagging), to determine if a viral moment possesses actual, measurable commercial viability beyond mere digital applause.
Platform-specific algorithms also dictate the structural format of trends. On emerging discovery platforms like Lemon8, the algorithm distinctly favors high-value, story-driven carousel posts integrated with heavily researched, niche keywords placed prominently in the title and caption. The primary currency on Lemon8 for triggering algorithmic push is the “Save” metric, prioritizing utilitarian, aesthetically pleasing content over ephemeral entertainment.
Extracting Weak Signals from Dark Social and Niche Communities
Traditional search engines and public feeds reflect intent that has already crystallized into the mainstream. To spot trends fundamentally before they break out, analysts must monitor the digital environments where intent is initially formulated: niche communities, specialized subreddits, and private messaging environments.
Exploiting the Reddit API (PRAW) for Weak Signals
Reddit functions as an expansive, globally distributed incubator for micro-trends. Because its architecture is structured entirely around niche topical interests rather than broad, personality-driven social graphs, it provides highly concentrated thematic data. Analysts utilize the Python Reddit API Wrapper (PRAW) to systematically extract conversational data, track emerging keywords, and analyze community sentiment in real time.
By establishing active socket connections set to listen on specific ports (e.g., port 9999), data scientists can continuously stream JSON data objects containing comments from targeted subreddits, extracting vital metadata such as the comment text, previous comment context, author details, and exact timestamps. This unstructured text is then processed using NLP and sentiment classifiers to identify subtle shifts in consumer attitudes. When multiple “weak signals”—such as recurring mentions of a new material practice or software tool—begin to converge and persist across different, seemingly unrelated niche subreddits, it signals the early incubation phase of a breakout trend.
Navigating Dark Social: Discord, Telegram, and Private Networks
As public social media feeds become increasingly saturated with low-quality, AI-generated content, authentic community growth and trend formation are aggressively migrating to private environments—frequently referred to within the industry as “dark social”. A recent survey of U.S.
small businesses confirmed this paradigm shift, with 64% citing social platforms as their primary traffic driver, officially topping organic search at 52%. Discord servers, Slack communities, Telegram groups, and WhatsApp channels represent high-intent engagement hubs where the earliest iterations of trends are discussed completely away from the public eye and algorithm scraping.
By 2026, chasing mass virality on public feeds is yielding sharply diminishing returns compared to building deep resonance within these closed networks. To monitor trends here, server owners and analysts rely on built-in analytics suites, such as Discord’s native “Server Insights,” alongside third-party tracking bots like Statbot, ServerStats, and Member Count, to measure granular engagement metrics. By analyzing which specific channels generate the most interaction, identifying peak temporal activity times, and heavily tracking member acquisition sources, researchers can trace the precise origin vectors of new ideas. For example, analyzing server traffic sources to find that a sudden influx of high-intent members originated from a specific external referral link or a directory like Disboard or Discadia often serves as a definitive early indicator that a micro-trend is beginning its crossover into broader awareness. Other niche forums like Indie Hackers, GrowthHackers, Stack Exchange, and Quora Spaces remain critical listening posts for B2B and SaaS marketing trends, where early adopters actively critique tools before they reach mass market validation.
Curated Intelligence: The Role of Human Expertise
While machine learning and API data extraction provide the necessary quantitative scale for content discovery, the sheer volume of information overload necessitates qualitative, human-curated intelligence to differentiate signal from noise. Mathematical velocity alone cannot ascertain cultural resonance.
The Newsletter Ecosystem
To maintain situational awareness, professionals rely heavily on highly focused industry newsletters that serve as curated heuristic filters. These publications synthesize raw data into strategic foresight, preventing the algorithmic bias of chasing hollow fads. Prominent sources include Geekout (by Matt Navarra) for immediate social platform feature updates, Marketing Brew for daily macroeconomic marketing shifts, The Daily Carnage for tactical tools, and Growthnotes for deep-dive case studies. For content specifically, newsletters like The Tilt, Exploding Topics, and Search Engine Journal provide indispensable context on search algorithm fluctuations and generative AI impacts. By cross-referencing insights from these diverse sources, analysts can validate the authenticity and long-term viability of the trends flagged by their predictive software stacks.
The 5-Step Human Forecasting Framework
Theory and software mean nothing without disciplined strategic implementation. Leading foresight practitioners utilize a formal 5-step trend forecasting framework to systematically spot business shifts early:
- Cross-Industry Pattern Recognition: Deliberately observing adjacent industries to see how they solve similar problems. Normalized practices in one sector often serve as early emergent indicators for another.
- Weak Signal Detection: Establishing a continuous discipline (e.g., a 90-day tracking system) to capture scattered, subtle evidence of emerging change without immediate judgment.
- Inflection Point Analysis: Applying filters to the collected signals. Analysts evaluate convergence (multiple signals pointing the same way), persistence (signals appearing across time), and amplification (increasing discussion volume) to identify the trend’s inflection point.
- Stakeholder Impact Mapping: Analyzing the socio-economic ripple effects of the trend to determine who benefits and who is disrupted.
- Scenario Planning: Developing specific strategic contingencies based on the mapped trend data to proactively align brand positioning.
By actively mapping these trends within a “Culture Map” or “Trend Map,” organizations can transition from a reactive posture to a proactive strategy, identifying white space for brand differentiation and ensuring their messaging remains culturally resonant.
Applied Case Studies in Predictive Marketing
The integration of these theoretical frameworks, mathematical models, platform metrics, and human curation culminates in applied, highly lucrative digital marketing strategy. A retrospective analysis of landmark digital marketing campaigns clearly demonstrates how brands achieve outsized Return on Investment (ROI) by leveraging early trend detection, cultural resonance, and the mechanics of virality.
Comprehensive analysis of landmark digital marketing campaigns, illustrating the direct correlation between early trend integration, strategic execution difficulty, and ultimate commercial outcomes.
| Brand / Campaign Identity | Core Strategy & Cultural Trend Leverage | Strategic & Tactical Difficulty | Primary Commercial Outcomes |
|---|---|---|---|
| Old Spice “The Man Your Man Could Smell Like” | Leveraged the emerging cultural trend of rapid-fire, surrealist internet humor. Addressed a severe demographic aging problem by pivoting to high-velocity, shareable aesthetics that appealed directly to a younger, digitally native cohort. | Medium-High: Required highly agile, rapid, personalized content creation to sustain the viral momentum. | 125% increase in product sales; 75% increase in brand awareness; massive ongoing social momentum and cultural relevance. |
| Spotify “Data-Driven Personalization (Wrapped)” | Capitalized early on the macro-trend of hyper-personalization. Utilized deep predictive analytics and user data to generate highly shareable, visually optimized User-Generated Content (UGC) built inherently for social platform velocity. | High: Required highly sophisticated data analytics, backend engineering, and seamless data visualization pipelines. | 90% user engagement; rapid subscriber growth; successfully cultivated a recurring, highly anticipated global cultural event. |
| Dollar Shave Club “Launch Video” | Intercepted the socio-cultural shift away from legacy corporate messaging toward authentic, unfiltered, founder-led content. Utilized a low-budget format heavily optimized for YouTube retention metrics and algorithmic sharing. | Low-Medium: Simple, low-budget production, but strategically highly reliant on capturing an unpredictable cultural viral moment. | Explosive initial subscriber base acquisition; ultimately culminated in a $1B acquisition by Unilever, disrupting the entire legacy market. |
| Coca-Cola “Share a Coke” | Merged mass-produced physical products with the digital trend of personalized experiences and social identity projection. Leveraged the fundamental semiotic desire for individual recognition within a globally standardized product. | Medium-High: Required complex physical product customization, massive global logistics, and seamless digital integration. | 2.5% tangible sales increase in the US market; generated over 125,000 social posts via organic UGC, demonstrating immense global resonance. |
| Dove “Real Beauty Sketches” | Tapped into the profound, emergent cultural conversation regarding authentic representation, mental health, and female empowerment. Addressed consumer pain points directly, utilizing a strategic seeding approach in key markets to initiate global sharing. | High: Required deep emotional intelligence, careful cultural navigation, and coordinated global multi-language distribution. | Over 100 million views within a month; became one of the most-watched video ads of all time; established unparalleled brand loyalty and credibility. |
In each of these critical instances, the brands successfully identified an emergent cultural or technological shift long before their competitors—whether it was the nascent consumer demand for algorithmic personalization (Spotify), the appetite for authentic, anti-corporate humor (Dollar Shave Club), or the seamless integration of physical identity with digital sharing (Coca-Cola). By acting upon these weak signals before they reached market saturation, the brands secured an insurmountable first-mover advantage, effectively dictating the subsequent conversation within their respective industries. Other successful campaigns, such as Range Rover Evoque’s speed bump stunt and Google’s “Furever Friends” (the most shared video ad of all time with over 6 million shares), relied on universal emotional triggers like nostalgia and empathy, perfectly timed for digital distribution mechanisms.
The Convergence of Data, Semiotics, and Speed
The discipline of predictive content discovery has irreversibly matured from an exercise in intuition into a rigorous, highly quantified science.
To successfully find trends before they break out in the hyper-competitive landscape of 2026, professionals must synthesize sociological theory, mathematical modeling, and platform-specific analytics into a cohesive operational framework.
Organizations must abandon the reliance on retrospective search volumes and pivot aggressively toward velocity metrics, continuously calculating the first and second derivatives of consumer demand to pinpoint exact inflection points. By systematically mining unstructured data from “dark social” environments like Discord and niche subreddits using advanced API wrappers and NLP sentiment analysis, analysts can intercept weak signals during their initial incubation phase. Crucially, this quantitative data must be rigorously filtered through the lens of cultural materialism and visual semiotics to differentiate transient, superficial fads from enduring, highly profitable cultural trends.
Ultimately, the future of content discovery belongs to entities that synthesize computational processing power with deep cultural anthropology. By mathematically interpreting the earliest statistical tremors of consumer intent—and profoundly understanding the human anxieties, values, and aesthetic desires driving those statistics—organizations can shift from passively observing the digital zeitgeist to actively architecting it.