Finance for Entrepreneurs: Pricing, Profit, Cash Flow, and Business Structure
Most entrepreneurs are good at the thing they sell and poor at the financial mechanics that determine whether selling that thing builds wealth or just generates noise.
Understanding business finance is not about becoming an accountant. It is about having enough clarity on a handful of critical numbers that you make better decisions: what to charge, when to hire, how to structure for tax efficiency, and when your business is genuinely healthy versus just busy.
This guide covers the financial concepts every entrepreneur needs to operate a profitable, sustainable business — not the entire accounting curriculum, but the 20% that drives 80% of the decisions that matter.
Table of Contents
- The Entrepreneur’s Financial Dashboard
- Revenue and Pricing: Getting Paid What You’re Worth
- Gross Margin: The Profitability Diagnostic
- Cash Flow: The Difference Between Alive and Dead
- Customer Acquisition Cost and Lifetime Value
- Burn Rate and Runway
- Tax-Efficient Business Structures
- When to Hire: The Financial Test
- Reading a Profit and Loss Statement
- Building Your Financial Operating System
The Entrepreneur’s Financial Dashboard
You do not need to monitor 50 metrics. You need to monitor 7 numbers consistently.
| Metric | What It Tells You | Target |
|---|---|---|
| Monthly Revenue | Top-line business health | Growing month-over-month |
| Gross Profit Margin | Whether your pricing covers delivery cost | 50%+ (services), 35%+ (products) |
| Net Profit Margin | What you actually keep | 15–25%+ |
| Cash on Hand (Runway) | How long you can survive without new revenue | 3–6 months of expenses |
| Accounts Receivable Aging | How quickly clients pay | Average 14–30 days |
| Customer Acquisition Cost | What you spend to get one customer | <1/3 of Customer LTV |
| Customer Lifetime Value | What one customer is worth | 3x+ CAC |
Check these monthly at minimum. A 30-minute monthly financial review is the minimum operating practice for any serious entrepreneur.
Revenue and Pricing: Getting Paid What You’re Worth
Underpricing is the most common financial mistake entrepreneurs make — and it compounds every time you win a new client at a below-market rate.
The True Cost of Underpricing
A consultant who charges $100/hour instead of $150/hour:
- On 100 billable hours/month: earns $10,000 instead of $15,000
- Annual revenue difference: $60,000
- Over 3 years: $180,000 in foregone revenue
The same consultant who raises their rate by 50% does not lose 50% of their clients. Research and experience consistently show that price-sensitive clients (those most likely to leave on a rate increase) are also the least profitable to serve — they require the most communication, generate the most scope creep, and pay slowest.
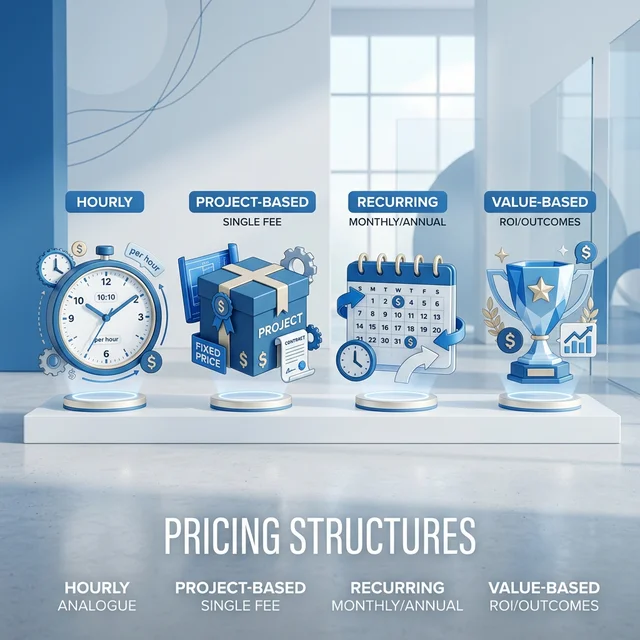
Pricing Methods
Cost-plus pricing — Calculate your costs, add a target margin. Simple, but ignores market rates and value created.
Service delivery cost: $800/month
Desired gross margin: 60%
Price = $800 / (1 - 0.60) = $2,000/month
Market rate pricing — Set prices at or near what comparable providers charge. This is the minimum you should charge, not the ceiling.
Value-based pricing — Price based on the economic value you create for the client. If your work generates $20,000/month in revenue for a client, charging $2,000/month (10% of value created) is justified and sellable.
graph TD
    A[Pricing Methods] --> B["Cost-plus Pricing"];
    B -- "Add target margin" --> B_desc("Simple, ignores market/value");
    A --> C[Market Rate Pricing];
    C -- "Match comparable providers" --> C_desc(Minimum you should charge);
    A --> D["Value-based Pricing"];
    D -- "Based on client's economic value" --> D_desc(Highest potential, most strategic);
Figure 1: Overview of Pricing Methods
Price Increases: The Annual Practice
Every business should raise prices annually. Even a 10% annual rate increase compounds significantly:
| Year | Rate | Monthly Revenue (100 hours) | Annual |
|---|---|---|---|
| Year 1 | $100/hr | $10,000 | $120,000 |
| Year 2 | $110/hr | $11,000 | $132,000 |
| Year 3 | $121/hr | $12,100 | $145,200 |
| Year 4 | $133/hr | $13,300 | $159,600 |
| Year 5 | $146/hr | $14,600 | $175,200 |
Five years of 10% annual increases — smaller than inflation in many markets — produces a 46% increase in effective hourly compensation.
Gross Margin: The Profitability Diagnostic
Gross profit margin is the single most important profitability metric for most service businesses. It measures how much revenue remains after the direct cost of delivering your service.
The Gross Margin Formula
Gross Profit = Revenue - Cost of Goods Sold (COGS)
Gross Margin % = (Gross Profit / Revenue) × 100
What counts as COGS for service businesses:
- Contractor/freelancer costs directly attributed to client work
- Software or tool subscriptions used exclusively for client delivery
- Direct labor costs (your own time at a cost rate, if you track it)
- Third-party services (ad spend management fees, stock photos for client use)
What does NOT count as COGS:
- Your own salary (above-the-line owner pay)
- Office expenses, equipment, marketing
- General software subscriptions used for internal operations
Gross Margin Benchmarks
| Business Type | Healthy Gross Margin |
|---|---|
| Digital marketing agency | 55–70% |
| SaaS business | 70–85% |
| Consulting (solo) | 75–90% |
| E-commerce (physical goods) | 30–50% |
| Professional services | 60–75% |
| Staffing / labor resale | 15–30% |
Diagnosing gross margin problems:
If your gross margin is below target, the cause is usually:
- Pricing too low for the delivery cost (raise prices or reduce scope)
- Contractor costs too high relative to client billing rate (negotiate rates or increase client billing)
- Scope creep absorbing unbilled hours (tighten scope definitions)
- Inefficient delivery processes (standardize and productize)
Cash Flow: The Difference Between Alive and Dead
Profitable businesses fail. The cause is almost always cash flow — running out of money while waiting for profitable work to translate into actual cash in the bank.
Why Cash Flow Differs from Profit
Consider a marketing agency:
- Signs a $5,000/month retainer in January
- Invoices on the 1st of the month
- Client pays on Net 30 terms
The agency delivered work in January. The invoice was sent February 1st. Cash arrives March 3rd.
Meanwhile, the agency paid its contractors in January and February. Payroll went out. Software subscriptions renewed. The bank account tells a different story than the profit and loss statement.
Cash Flow Management Principles
Invoice immediately and consistently. The moment work is delivered or the billing cycle begins, send the invoice. Every day of delay is a day your cash is working for the client rather than you.
Shorten payment terms. Standard is Net 30. Push for Net 14 or Net 7 where possible. Add late payment fees (1–2%/month) in your contracts. Many clients who say they need Net 30 pay in Net 15 when that is what is on the invoice.
Collect deposits for project work. A 50% deposit before starting a project is standard for established agencies. For new client relationships, 100% upfront is not unusual and is a reasonable risk management tool.
Bill retainers in advance. Retainer work should be invoiced at the start of the month for services to be delivered that month — not at the end. A client paying on the 1st means their money is in your account before you spend it delivering the work.
Build a cash reserve. Maintain 3–6 months of operating expenses in a business savings account. This buffer absorbs slow months, client churn, and unexpected costs without creating a cash crisis.
mindmap
  root((Cash Flow Management Principles))
    Invoice Immediately
    Shorten Payment Terms
    Collect Deposits
    Bill Retainers in Advance
    Build Cash Reserve
      3-6 months operating expenses
      Buffer for slow months & churn
Figure 2: Key Cash Flow Management Principles
The Cash Flow Forecast
A simple cash flow forecast shows money in and money out for the next 90 days:
| Month | Starting Cash | Revenue In | Expenses Out | Ending Cash |
|---|---|---|---|---|
| Month 1 | $15,000 | $22,000 | $18,000 | $19,000 |
| Month 2 | $19,000 | $20,000 | $19,000 | $20,000 |
| Month 3 | $20,000 | $18,000 | $21,000 | $17,000 |
Month 3 shows a dip below the month 2 position — a signal to either accelerate collections, delay discretionary expenses, or proactively pursue new revenue before the shortfall arrives.
Customer Acquisition Cost and Lifetime Value
CAC and LTV are the two metrics that determine whether your growth is sustainable.
Customer Acquisition Cost (CAC)
CAC = Total Sales & Marketing Spend / Number of New Customers Acquired
If you spent $3,000 on advertising, sales tools, and your own time in sales this month and acquired 5 new clients, your CAC is $600.
What counts in total sales and marketing spend:
- Advertising (Google Ads, Meta Ads, LinkedIn Ads)
- Your own time spent on sales and business development (at your effective hourly rate)
- CRM, proposal, and sales tool subscriptions
- Referral or affiliate commissions paid
- Networking events, travel for sales meetings
Customer Lifetime Value (LTV)
LTV = Average Monthly Revenue per Customer × Average Customer Lifespan (months)
Or for businesses with variable purchase amounts:
LTV = Average Purchase Value × Average Number of Purchases × Average Customer Lifespan
Example for a marketing agency:
- Average retainer: $2,500/month
- Average client retention: 14 months
- LTV = $2,500 × 14 = $35,000
The LTV:CAC Ratio
The benchmark for a sustainable business model:
| LTV:CAC Ratio | What It Means |
|---|---|
| Below 1:1 | Unsustainable — acquiring customers costs more than they’re worth |
| 1:1 to 2:1 | Marginal — barely breaking even on acquisition |
| 3:1 | Healthy — industry benchmark target |
| 5:1+ | Excellent — efficient acquisition or high LTV |
| 10:1+ | May indicate underinvestment in growth (not spending enough on acquisition) |
Improving LTV:CAC:
- Increase LTV: raise prices, reduce churn, upsell additional services
- Decrease CAC: improve conversion rates, shift to lower-cost acquisition channels (referrals, SEO, content)
Burn Rate and Runway
For pre-revenue startups, burn rate and runway are existential metrics. For profitable businesses, they measure financial resilience.
Burn Rate
Gross burn rate — Total monthly cash spent on all expenses, regardless of revenue.
Net burn rate — Monthly cash deficit: expenses minus revenue. If you are profitable, net burn is negative (meaning you are adding cash, not burning it).
Net Burn Rate = Total Monthly Expenses - Total Monthly Revenue
Runway
Runway = Cash on Hand / Net Monthly Burn Rate
A business with $120,000 in the bank burning $15,000/month more than it earns has 8 months of runway.
Runway thresholds:
- Under 3 months: emergency — immediate revenue generation or cost cutting required
- 3–6 months: caution — actively fundraising or accelerating sales
- 6–12 months: healthy — time to grow deliberately
- Over 12 months: strong — capacity to invest in longer-term initiatives
Tax-Efficient Business Structures
Business structure determines how your business income is taxed. Getting this wrong means paying significantly more tax than the law requires.
United States
Sole Proprietorship / Single-Member LLC: Default for solo operators. All net income is subject to self-employment tax (15.3% on the first $160,200 in 2024) plus income tax. Simple but expensive at higher income levels.
LLC taxed as S-Corporation: The most common structure for profitable service businesses. Allows income splitting between salary (subject to payroll tax) and distributions (not subject to self-employment tax). At $100,000 in net business income, S-Corp election can save $5,000–$10,000/year in self-employment taxes. Requires reasonable salary documentation and additional payroll administration.
C-Corporation: Pays flat 21% corporate tax rate. Subject to potential double taxation on dividends. Appropriate for businesses seeking VC funding (VCs prefer C-Corps) or with specific employee equity plans.
Recommended for most solo consultants and agencies: LLC taxed as S-Corp when net income exceeds $60,000/year.
United Kingdom
Sole Trader: Simple but pay personal marginal rates (up to 45%) on all profits plus National Insurance. Effective for very early-stage businesses.
Limited Company: Pays 19–25% corporation tax on profits. Owner pays themselves a combination of salary (below National Insurance threshold — approximately £12,570) and dividends (taxed at lower rates — 8.75% basic, 33.75% higher rate for 2024/25). Typically saves £5,000–£15,000/year in tax versus sole trader at equivalent profits above £40,000.
Australia
Sole Trader: Income taxed at personal marginal rates (up to 47% + Medicare levy). Straightforward but expensive at higher income.
Pty Ltd Company: Pays 25% corporate tax rate for businesses with under $50 million annual turnover. Business owners pay themselves salaries (deductible to the company) and receive dividends with franking credits. Typically advantageous above $80,000–$100,000 in net profit.
Discretionary Trust (Family Trust): Common structure for Australian small businesses. Allows income distribution to family members in lower tax brackets. Requires advice from an Australian accountant for compliance.
When to Hire: The Financial Test
Hiring is a financial decision, not an ego one. The right time to hire is when the cost of the hire is clearly covered by revenue generated or cost saved.
The Revenue Coverage Test
Before hiring, answer:
-
What does this hire actually cost? Include salary, payroll taxes (~7.65% in USA), benefits, equipment, software, and onboarding time. A $50,000 salary role costs $65,000–$75,000 total.
-
How does this hire generate or protect revenue? A delivery hire allowing you to take on more clients generates revenue. A support hire allowing you to spend more time selling and developing relationships generates revenue indirectly.
-
How long until the hire is profitable? A new hire typically takes 2–3 months to reach full productivity. Budget for a ramp period where costs exceed contribution.
Rule of thumb: A hire is financially justified when you can demonstrate how the role generates 2–3x its fully-loaded cost in revenue or cost savings within 12 months.
Contractor Before Employee
The financially prudent path: hire a contractor for a defined trial period before committing to employment. Contractors can be terminated without severance if the fit is wrong. Employees cannot, in most jurisdictions.
Use contractors to:
- Handle delivery overflow before committing to payroll
- Test a new service line before staffing it
- Trial individuals as potential full-time hires without employment commitment
Reading a Profit and Loss Statement
Your accountant produces a P&L. Most entrepreneurs do not know how to read it. Here is the structure:
REVENUE
  Gross Revenue                        $50,000
  Less: Returns/Refunds                ($500)
= Net Revenue                          $49,500

COST OF GOODS SOLD (COGS)
  Direct contractor costs              ($12,000)
  Direct tool subscriptions            ($800)
= Total COGS                           ($12,800)

GROSS PROFIT                           $36,700
Gross Margin %                         74.1%

OPERATING EXPENSES
  Owner salary                         ($8,000)
  Marketing and advertising            ($1,500)
  Software andtools (internal)        ($600)
  Accounting and legal                 ($500)
  Office and equipment                 ($300)
  Insurance                            ($200)
= Total Operating Expenses             ($11,100)

OPERATING PROFIT (EBITDA)              $25,600
Operating Margin %                     51.7%

  Tax provision (~25%)                 ($6,400)

NET PROFIT                             $19,200
Net Margin %                           38.8%
Key questions when reading your P&L:
- Is gross margin trending up or down over 3–6 months?
- Which operating expense categories are growing fastest?
- Is net margin covering owner goals and growth reinvestment?
Building Your Financial Operating System
The Minimum Financial Infrastructure
| Tool | Purpose | Cost |
|---|---|---|
| Accounting software (QuickBooks/Xero/Wave) | Bookkeeping, P&L, cash flow | Free–$50/month |
| Invoicing (built into accounting tool) | Send and track invoices | Included |
| Business bank account | Separate business finances | Free–$25/month |
| Business savings account | Cash reserve (3–6 months expenses) | Free |
| Payroll software (if hiring) | QuickBooks Payroll, Gusto | $40–80/month |
| Annual CPA/accountant | Tax returns, structure advice | $500–$3,000/year |
The Monthly Financial Routine
Week 1 of each month:
- Review prior month’s P&L
- Check gross and net margins vs. targets
- Review accounts receivable — chase overdue invoices
- Update 90-day cash flow forecast
Week 2:
- Review pending proposals and pipeline
- Update revenue forecast for next 60 days
Quarter-end:
- Review LTV and CAC for the quarter
- Compare performance to budget
- Review pricing — are rates where they should be?
Annually:
- Meet with accountant for tax planning (not after filing — before the year ends)
- Review business structure — is current structure still optimal?
- Set revenue, margin, and growth targets for the next year
Related Guides
- How to Calculate CAC and LTV for Your Business (With Examples)
- Profit Margins in Agency Business: What’s Realistic in 2026?
- How to Legally Structure a Consulting Business in USA, UK, and Australia
- Best Business Bank Accounts in USA, UK, UAE for Startups 2026
- How to Start a Digital Marketing Agency in 2026
Related Posts and Resources
- How to Start a Digital Marketing Agency
- Agency Pricing Models in 2026
- Marketing Retainer Pricing Guide
- How to Price Marketing Services
- How to Calculate CAC and LTV
- Business Budgeting for Startups
- Consulting Business Structure Guide
- Best Business Bank Accounts
- Small Business CRM Guide
- Digital Marketing in Nepal (Complete Guide)