Unit 8.3
The Business Analytics Process: From Problem to Deployment
Learning Objectives
By the end of this chapter, you will be able to:
- ✅ List and describe the six phases of the Business Analytics process.
- ✅ Explain the importance of the Business Understanding phase.
- ✅ Understand why Data Preparation is often the most time-consuming phase.
- ✅ Describe the final steps of Evaluation, Deployment, and Communication.
A Systematic Approach 📊
Business Analytics isn't just about making charts. It's a structured, systematic process to turn business problems into actionable solutions.
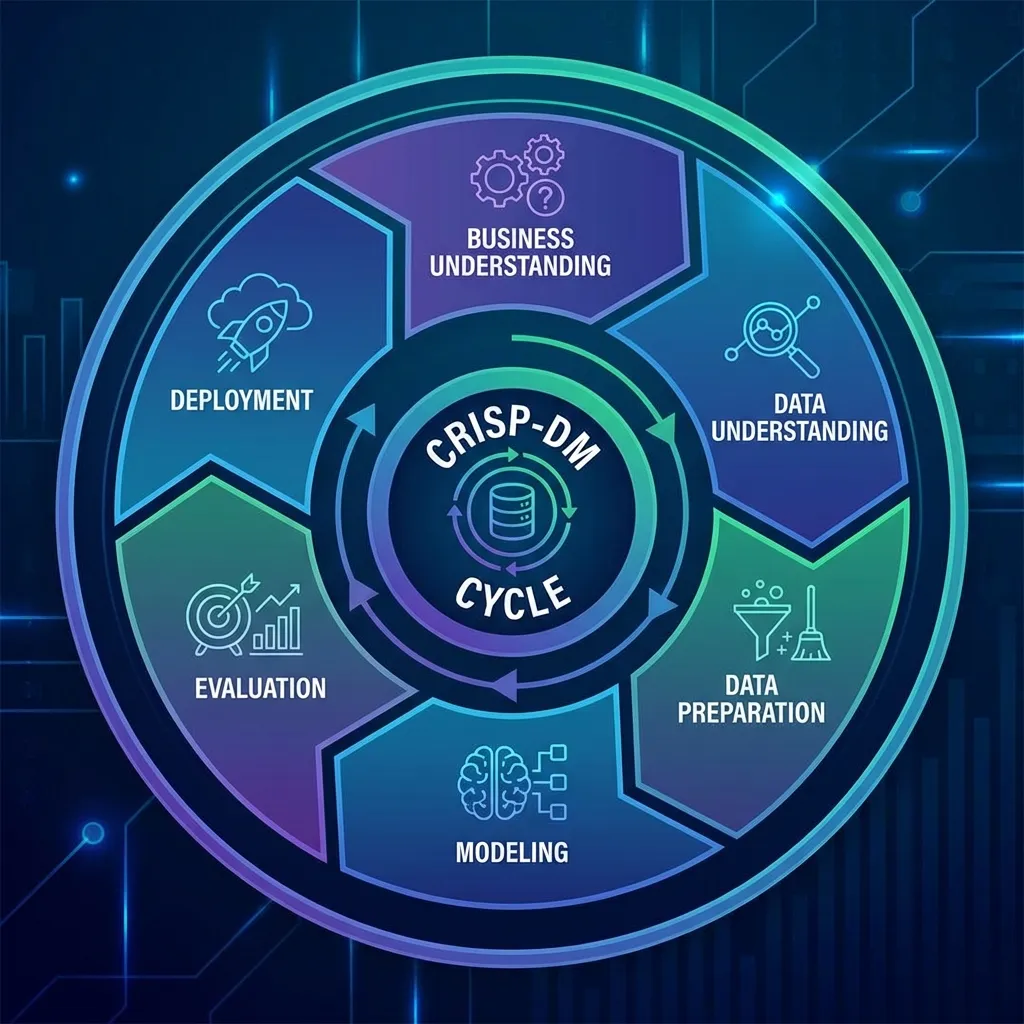
This process is closely related to the CRISP-DM (Cross-Industry Standard Process for Data Mining) methodology, a widely accepted standard.
The 6 Phases of Business Analytics
- 🎯 Business Understanding
- 🔍 Data Understanding
- ⚙️ Data Preparation
- 📈 Modeling
- ✅ Evaluation
- 🚀 Deployment & Communication
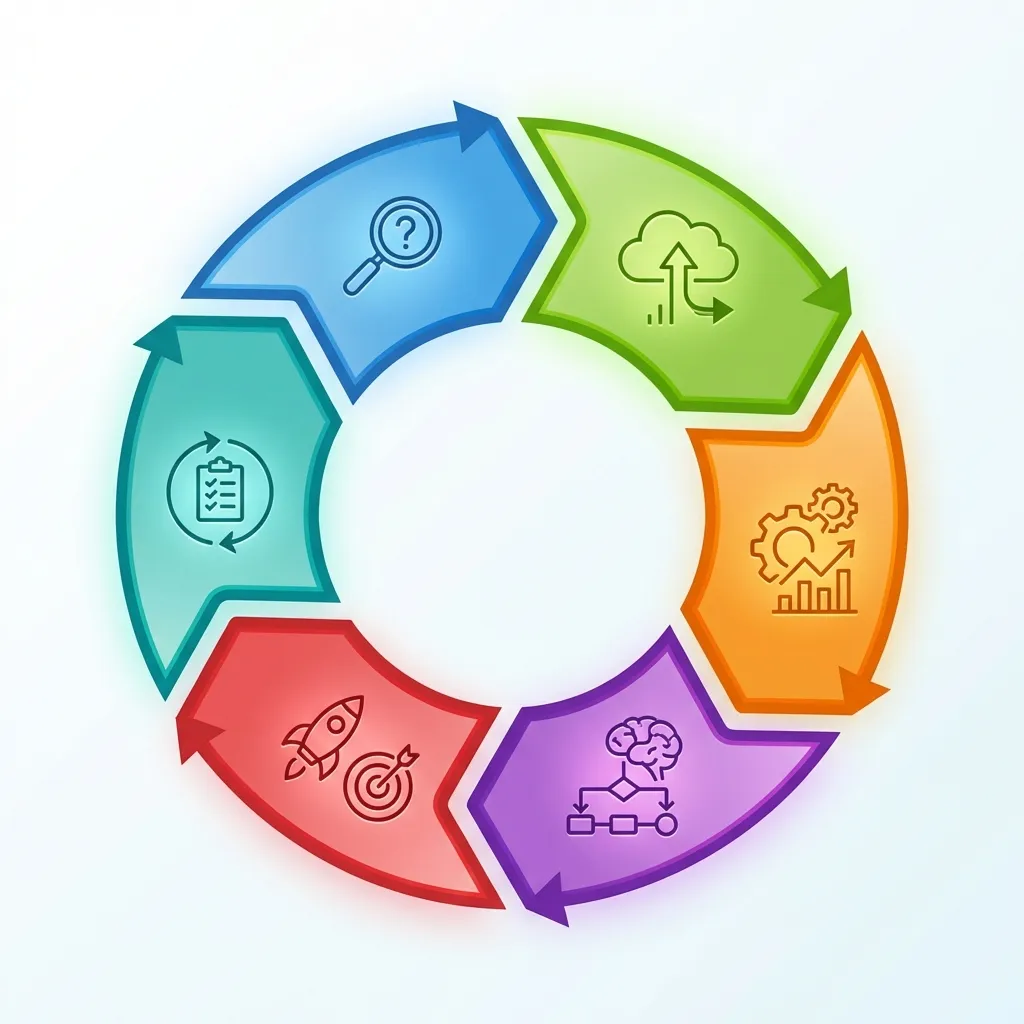
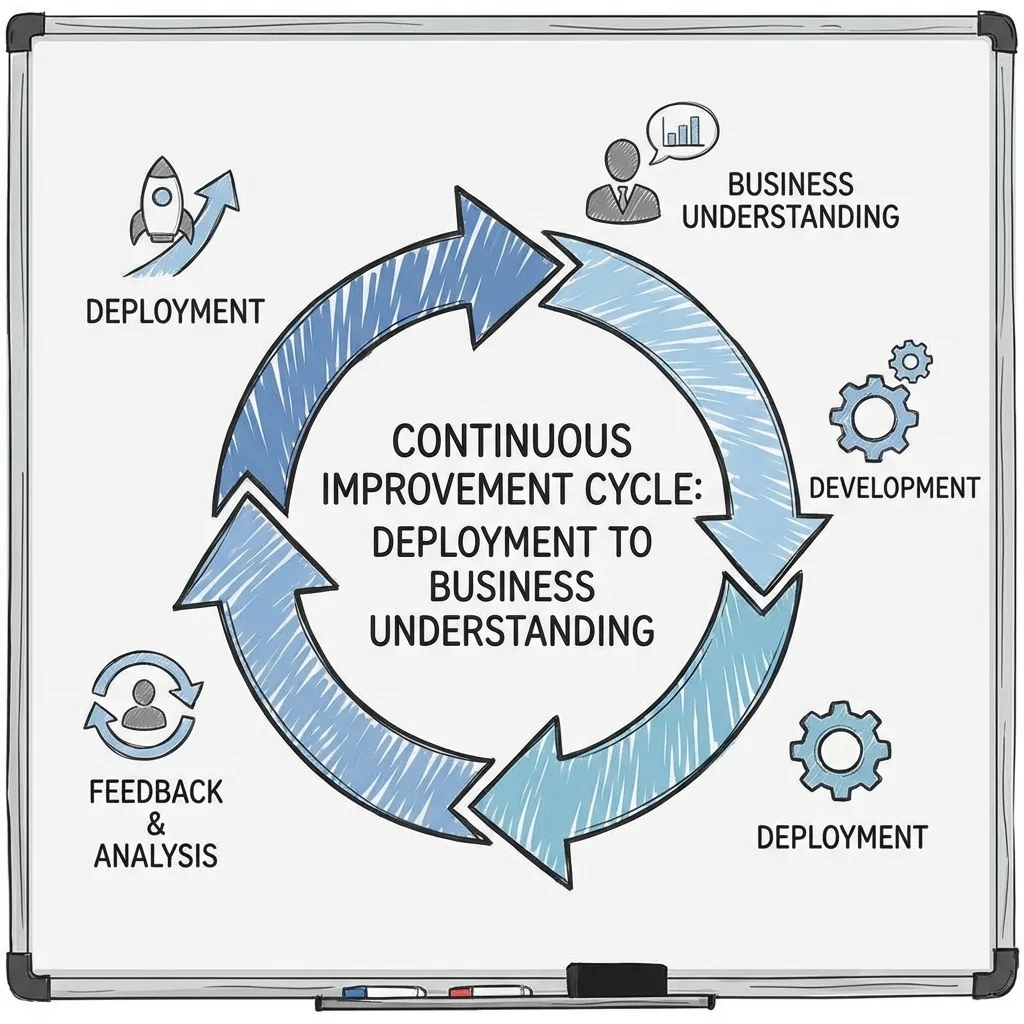
An iterative cycle, not a one-way street.
Interactive: Arrange the Phases
Click the phases in the correct CRISP-DM order. Build the sequence from left to right.
Your sequence:
Phase 1: 🎯 Business Understanding
This is the most critical first step. Before touching any data, you must understand the business goal.
Key Questions to Ask Stakeholders:
- What specific business decision needs to be made?
- What question are we trying to answer with data?
- How will we measure the success of this project?
Without a clear objective, the analysis is destined to fail.
Interactive: Classify the Business Objective
Each scenario describes a business question. Select the correct type of analytics objective — Descriptive, Predictive, or Prescriptive.
Phase 2: 🔍 Data Understanding
Once the goal is clear, we identify and explore the necessary data.
Tasks in this phase:
- Identify relevant data sources (Internal CRM, external market data, etc.).
- Collect an initial data sample.
- Perform Exploratory Data Analysis (EDA) to check quality and structure.
Data Sources
Internal: CRM, ERP Systems, Sales Records
External: Government Data, Social Media, Market Research Reports
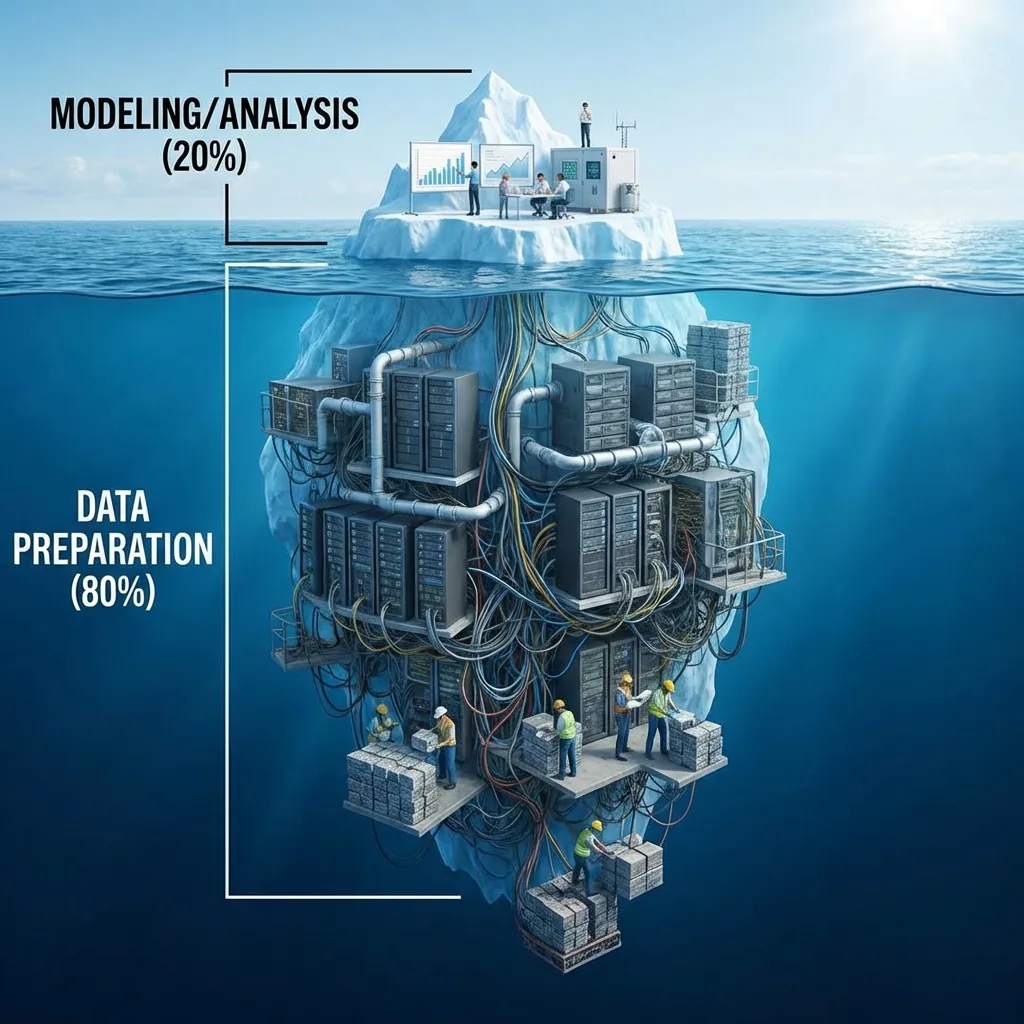
Phase 3: ⚙️ Data Preparation
Raw data is almost never ready for analysis. This phase transforms it into a clean, usable dataset.
⚡ Fact: This is often the most time-consuming phase, taking up to 80% of the project's time!
Data Cleaning
Handling missing values, fixing errors, removing duplicates.
Data Integration
Combining data from multiple sources into one dataset.
Data Transformation
Formatting data, creating new variables (e.g., Age from Date of Birth).
Interactive: Data Cleaning Simulator
This sample customer dataset has 5 data quality issues. Hover over red cells for a hint, then click to fix them.
Phase 4: 📈 Modeling
Here, we apply statistical and machine learning techniques to find patterns and insights in the prepared data.
The choice of model depends entirely on the business objective from Phase 1.
- Descriptive Models: What happened? (e.g., Sales reports)
- Predictive Models: What will happen? (e.g., Customer churn prediction)
- Prescriptive Models: What should we do? (e.g., Supply chain optimization)
Interactive: Model Type Card Sorter
Drag each scenario card into the correct model-type column, or click a card and then click a column to sort it.
Phase 5: ✅ Evaluation
A model isn't useful unless it's accurate, reliable, and actually solves the business problem.
- Rigorously test the model's performance against the success criteria defined in Phase 1.
- Review results with business stakeholders to ensure they are understandable and useful.
- If the model fails, it's back to the Modeling phase to try a different approach. This is why the process is iterative.
Phase 6: 🚀 Deployment & Communication
The final step is to put the insights into action to create business value.
Communication
Presenting findings to decision-makers in a clear, compelling way.
Tools: Reports, dashboards, data visualizations that tell a story.
Deployment
Integrating a model into a live production system for automated action.
Example: A fraud detection model integrated into a bank's transaction system.
Interactive: Analytics Project Time Allocator
You have 100 hours for an analytics project. Use the sliders to allocate time across the 6 phases, then compare against industry benchmarks.
Practical Application: Nepal Context
Scenario: Reducing Customer Churn for a Nepali Telco
A major telecom provider in Nepal like Ncell or Nepal Telecom wants to reduce the number of customers switching to competitors.
- Business Understanding: 🎯 Reduce monthly customer churn by 5%. Success is measured by the retention rate of at-risk customers.
- Data Prep: ⚙️ Combine call detail records, recharge card data, and customer service logs into one clean dataset.
- Modeling: 📈 Build a predictive model to identify customers with a high probability of churning in the next 30 days.
- Deployment: 🚀 Integrate the model with the CRM. Automatically flag at-risk customers and send them a targeted retention offer (e.g., a special data pack).
Key Takeaways
- The BA process is a structured, iterative methodology for solving business problems with data.
- 🎯 Business Understanding is the most critical first step. Get this wrong, and the whole project fails.
- ⚙️ Data Preparation is typically the most time-consuming and labor-intensive phase.
- 🚀 The final goal is deployment and communication to drive action and create tangible business value.
Questions & Discussion
- Why is it so important to have clear success criteria defined in the Business Understanding phase?
- What is the difference between "Communication" and "Deployment" in the final phase of the process?
Thank You
Next Topic: Unit 8.4: Descriptive Analytics: Understanding What Happened | IT 233