Unit 8.2
Managers and Decision Making: The Role of Analytics
Learning Objectives
By the end of this chapter, you will be able to:
- ✅ Differentiate between structured, semi-structured, and unstructured decisions.
- ✅ Identify the three phases of the decision-making process.
- ✅ Explain how business analytics can support each phase of the decision-making process.
The Nature of Managerial Decision Making
Decision-making is a fundamental part of a manager's job, from frontline supervisors to senior executives.
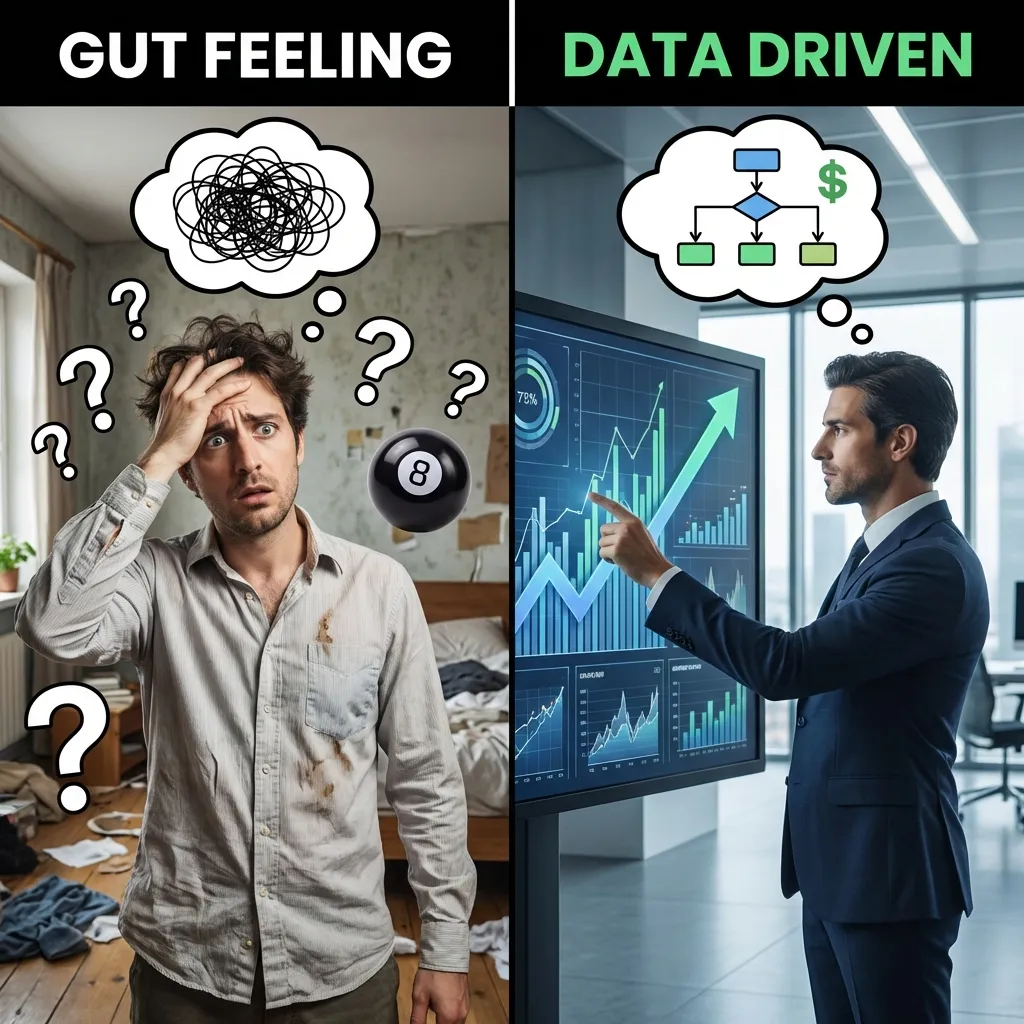
⚡ Goal: Use business analytics to make more effective, data-driven decisions.
Analytics provides the tools and insights to move from "gut feeling" to informed choices.
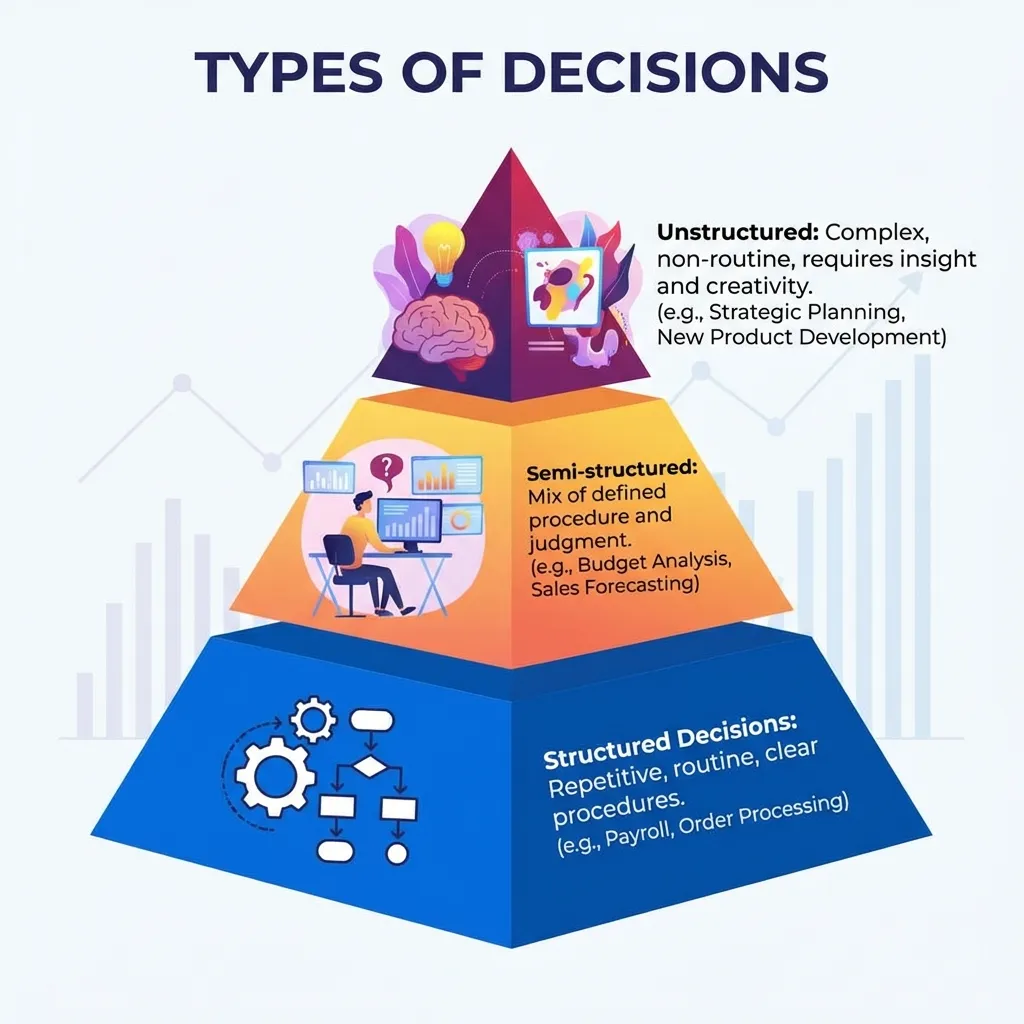
Three Types of Managerial Decisions
1. Structured
Repetitive, routine decisions with clear, established rules.
2. Semi-structured
Decisions with some clear elements but also require human judgment.
3. Unstructured
Complex, non-routine decisions with no pre-defined procedure.
Interactive: Decision Type Classifier
Read each scenario and classify it as the correct decision type.
Type 1: Structured Decisions
Definition: Repetitive and routine decisions where a clear procedure exists. They can often be automated.
- Who: Typically lower-level managers.
- Characteristics: Well-defined, clear rules, high-frequency.
Example: Granting Overtime Pay
The rule is simple: If an employee works > 40 hours, they get overtime. A system can easily automate this decision.
Type 2: Semi-structured Decisions
Definition: Only part of the problem has a clear-cut answer. Requires a mix of data analysis and manager's judgment.
- Who: Typically mid-level managers.
- Characteristics: Combination of standard procedures and individual judgment.
Example: Setting a Marketing Budget
Data from past campaigns provides a baseline (structured part), but judgment is needed for market conditions and product potential (unstructured part).
Type 3: Unstructured Decisions
Definition: Non-routine, complex decisions requiring significant judgment, evaluation, and insight. No agreed-upon procedure exists.
- Who: Typically senior executives.
- Characteristics: Novel, complex, high-impact, ambiguous.
Example: Entering a New Market
Deciding to acquire a company or invest in an unproven technology involves immense uncertainty and strategic insight.
Where Analytics Shines Brightest
While analytics can support all decision types, its value increases with complexity.
Structured Decisions
Often fully automated; analytics helps build the initial rules.
Semi-structured & Unstructured
This is where analytics is most valuable. It provides data-driven insights to support and enhance a manager's judgment, not replace it.
Interactive: Analytics Value Spectrum
Click on each decision type to explore how analytics contributes to that tier.
Click a decision type above to explore how analytics helps.
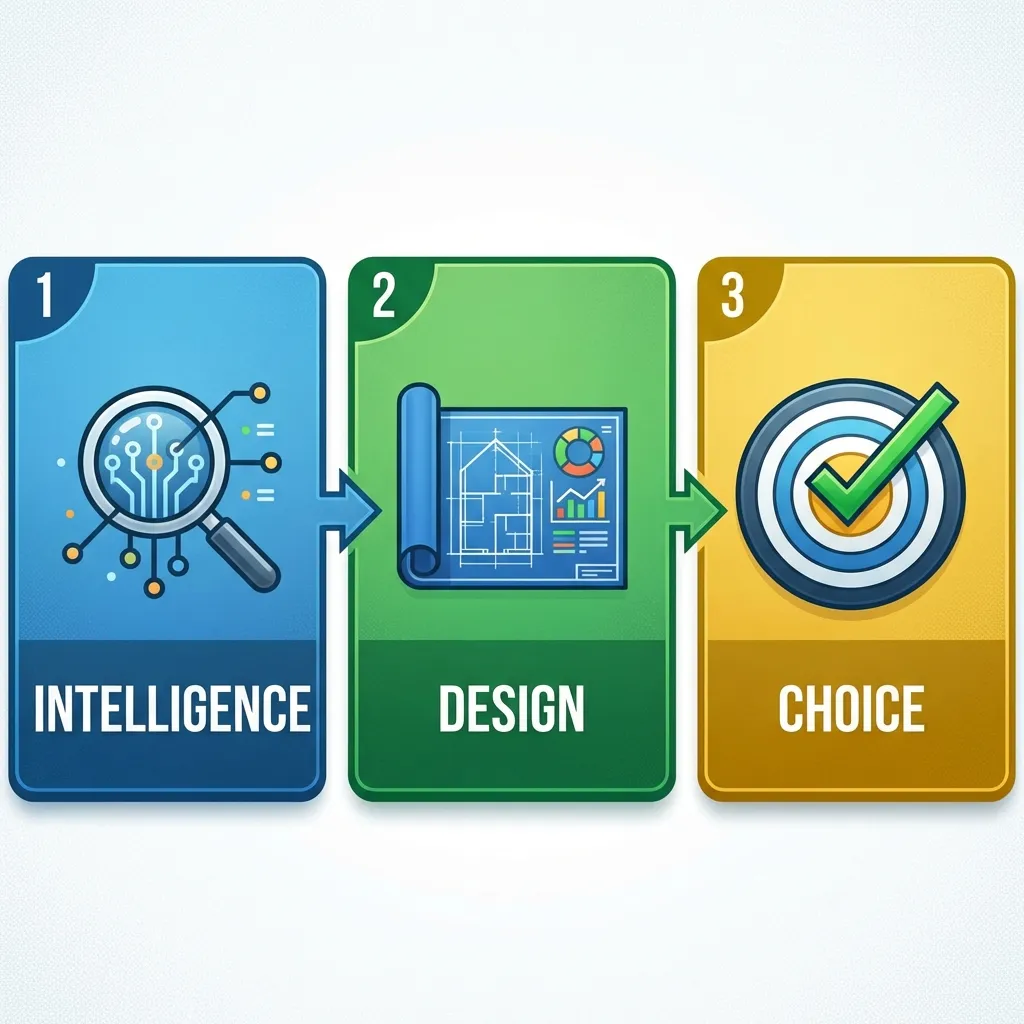
The Decision-Making Process
Nobel laureate Herbert Simon outlined a 3-phase model for decision-making.
Interactive: Match the Phase
Click an activity card to select it, then click the correct phase to place it.
Phase 1: Intelligence 🔍
What is it? Identifying and defining the problem or opportunity. Searching the environment to understand what needs to be decided.
How Analytics Helps (Descriptive):
- Scan large datasets to identify trends or patterns.
- Flag deviations or anomalies that signal a problem.
- Discover new opportunities hidden in the data.
Phase 2: Design 📊
What is it? Developing and analyzing possible alternative courses of action. Brainstorming solutions and evaluating their feasibility.
How Analytics Helps (Predictive):
- Use "what-if" analysis to model potential outcomes.
- Forecast the results of different alternatives.
- Quantitatively compare options based on predicted performance.
Interactive: What-If Budget Modeler
Adjust the sliders below to model a marketing campaign. This simulates the Design phase of analytics.
Phase 3: Choice 🎯
What is it? Selecting one of the alternatives. This is the act of making the final decision.
How Analytics Helps (Prescriptive):
- Provide interactive dashboards to explore trade-offs.
- Use visualizations to make complex comparisons easier.
- Recommend the optimal choice that aligns with business goals.
Practical Application: A Nepali Context
Scenario: A Nepali ride-sharing company (e.g., Pathao) considers expanding to a new city like Butwal.
- Intelligence: Analyze government census data, smartphone penetration rates, and current app usage data from nearby regions to identify Butwal as a high-potential market.
- Design: Model different launch strategies using predictive analytics:
- Option A: Start with bike-rides only.
- Option B: Launch bikes and cars simultaneously.
- Option C: Partner with local taxi services.
- Choice: A prescriptive analytics dashboard compares the projected ROI, rider acquisition cost, and operational complexity for each option, helping executives make the final Go/No-Go decision.
Interactive: Pathao Expansion Quiz
For each action taken by Pathao's team, identify which Simon Decision-Making phase it belongs to.
Key Takeaways
- Decisions are categorized as structured (routine), semi-structured (mix), and unstructured (complex).
- Business analytics is most powerful for supporting semi-structured and unstructured decisions where human judgment is critical.
- The decision-making process follows three phases: Intelligence (what's the problem?), Design (what are our options?), and Choice (what will we do?).
- Different types of analytics support each phase: Descriptive (Intelligence), Predictive (Design), and Prescriptive (Choice).
Thank You!
Any questions?